Daniocell
gas2a (hematopoietic / vasculature)
growth arrest-specific 2a
ZFIN
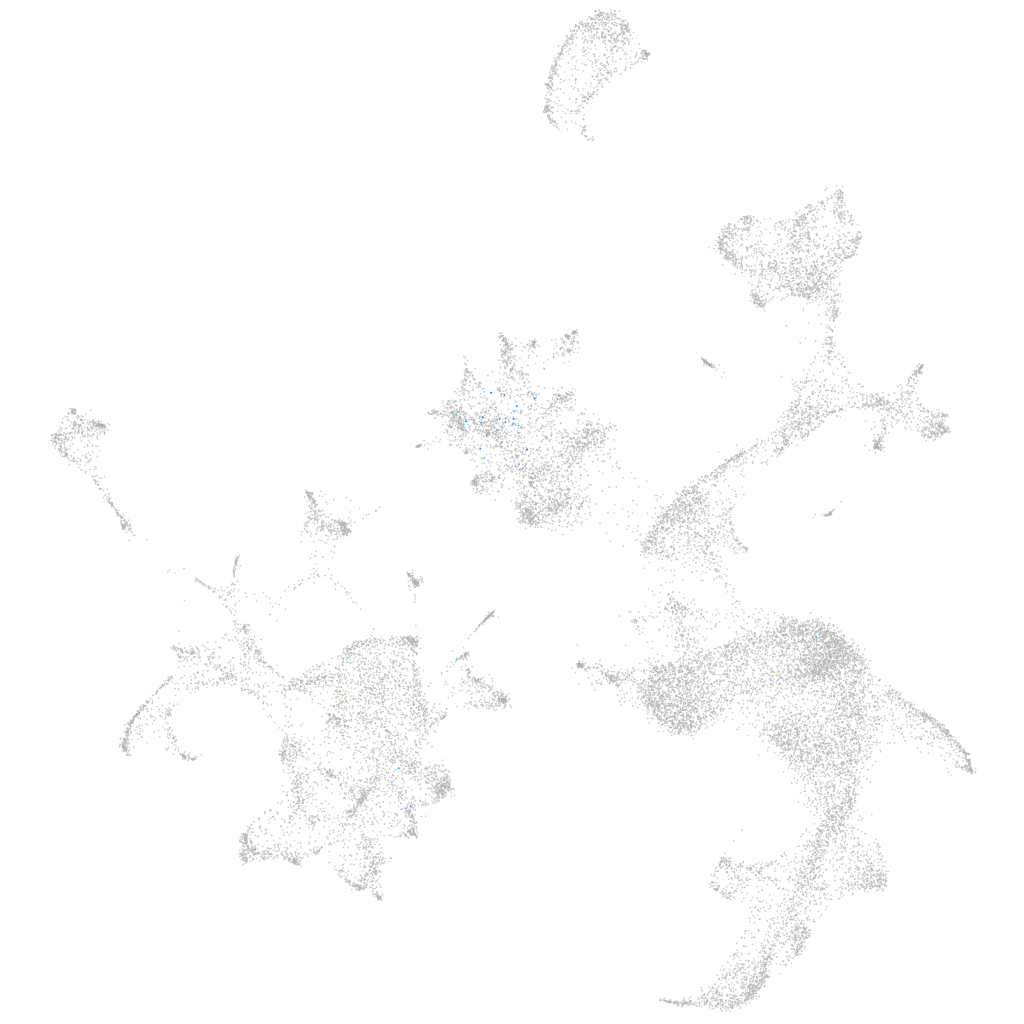
Gene expression UMAP
Display:
Expression
Stage
Other cell groups
all cells
blastomeres
PGCs
endoderm
axial mesoderm
muscle
mural cells /
non-skeletal muscle
mesenchyme
hematopoietic /
vasculature
pronephros
neural
spinal cord / glia
eye
taste / olfactory
otic / lateral line
epidermis
periderm
fin
ionocytes / mucous
pigment cells
Expression by stage/cluster
Correlated gene expression
Positive correlation
Negative correlation
Gene
r
Gene
r
mir733
0.185
hbbe3
-0.017
odf3l2b
0.182
blf
-0.014
BX908770.1
0.175
arl6ip1
-0.013
lrrc74a
0.153
urod
-0.013
vwa10.2
0.142
spi1b
-0.013
si:dkey-28d5.12
0.115
znfl2a
-0.013
XLOC-044048
0.107
tmsb1
-0.013
XLOC-040812
0.104
nrros
-0.013
LOC100536797
0.101
rac2
-0.013
commd10
0.097
si:ch73-248e21.7
-0.013
fbln5
0.093
fcer1gl
-0.013
LOC110439936
0.090
tfr1a
-0.012
si:ch211-15j1.1
0.090
cbr1l
-0.012
col12a1a
0.089
pycard
-0.012
crb1
0.087
krt4
-0.012
LOC101884200
0.086
parvg
-0.012
or106-10
0.086
arhgdig
-0.012
XLOC-039821
0.085
hmbsb
-0.012
XLOC-039668
0.080
si:ch211-226m16.2
-0.012
AL590146.1
0.080
igfbp1a
-0.012
XLOC-011673
0.079
si:ch211-212k18.7
-0.012
sfrp2
0.079
gapdh
-0.012
si:dkey-85n7.8
0.079
coro1a
-0.012
BX664742.3
0.076
itm2bb
-0.012
LOC101884197
0.075
dnase1l4.2
-0.012
si:ch211-171b20.3
0.075
tspan36
-0.012
adamts15b
0.074
gsto2
-0.012
loxa
0.074
si:dkey-261j4.4
-0.012
LOC108182677
0.073
gadd45ab
-0.011
XLOC-008016
0.073
crema
-0.011
si:dkeyp-69b9.3
0.073
tmem14ca
-0.011
col5a1
0.072
cd83
-0.011
mamdc2b
0.072
cxcr4b
-0.011
ms4a17a.7
0.071
pgd
-0.011
thbs4b
0.070
mbnl1
-0.011