Daniocell
gapvd1 (mural cells / non-skeletal muscle)
GTPase activating protein and VPS9 domains 1
ZFIN
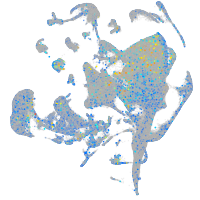
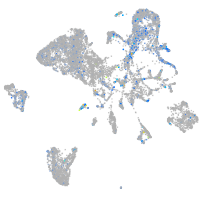
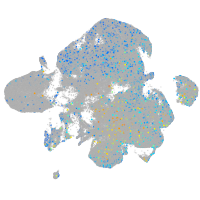
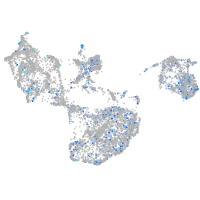
Gene expression UMAP
Display:
Expression
Stage
Other cell groups
all cells
blastomeres
PGCs
endoderm
axial mesoderm
muscle
mural cells /
non-skeletal muscle
mesenchyme
hematopoietic /
vasculature
pronephros
neural
spinal cord / glia
eye
taste / olfactory
otic / lateral line
epidermis
periderm
fin
ionocytes / mucous
pigment cells
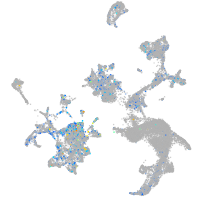
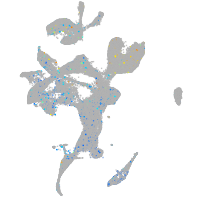
Expression by stage/cluster
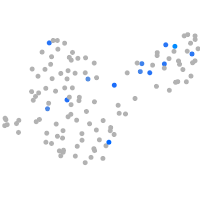
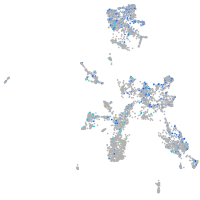
Correlated gene expression
Positive correlation
Negative correlation
Gene
r
Gene
r
zgc:195212
0.226
fstl1b
-0.047
LOC101885765
0.196
eef1da
-0.044
opn4b
0.196
enah
-0.043
ros1
0.194
pdgfrb
-0.041
LOC103910418
0.193
pmp22b
-0.037
XLOC-016838
0.180
cd81a
-0.036
LOC110439394
0.177
rps8a
-0.035
XLOC-037388
0.168
col1a2
-0.035
si:dkey-222b8.4
0.155
ppdpfb
-0.035
CT737162.3
0.153
crlf3
-0.035
CABZ01058452.1
0.149
itga1
-0.035
si:dkey-7f16.3
0.144
aldh9a1a.1
-0.035
LOC110437940
0.143
rims2a
-0.035
si:ch211-59d8.3
0.143
gdf6a
-0.035
CR450814.1
0.141
irf2bp2b
-0.035
mcf2a
0.136
snap23.1
-0.035
si:ch211-250e5.2
0.136
polr2b
-0.035
FO704821.1
0.132
ugt1b5
-0.034
LOC108190590
0.129
sh3bgrl
-0.034
nlrb5
0.129
coa3a
-0.034
brip1
0.127
grb10a
-0.034
SLC35G1
0.123
fam120c
-0.033
slc30a8
0.119
rab12
-0.033
acss2l
0.119
tmem119b
-0.033
zgc:112001
0.118
si:ch211-270g19.5
-0.033
hcn5
0.117
ela2l
-0.031
adad1
0.116
aldob
-0.031
si:ch211-147k10.6
0.116
cyp2ad3
-0.031
ptdss2
0.115
zgc:110239
-0.031
LOC103911092
0.114
jdp2b
-0.031
CT583651.1
0.114
bmpr1ba
-0.031
tspoap1
0.113
hspg2
-0.030
cyp2x9
0.113
zgc:112982
-0.030
her11
0.113
pik3r1
-0.030
CU929402.1
0.112
si:ch211-152p11.4
-0.030