Daniocell
fhit (fin)
fragile histidine triad diadenosine triphosphatase
ZFIN
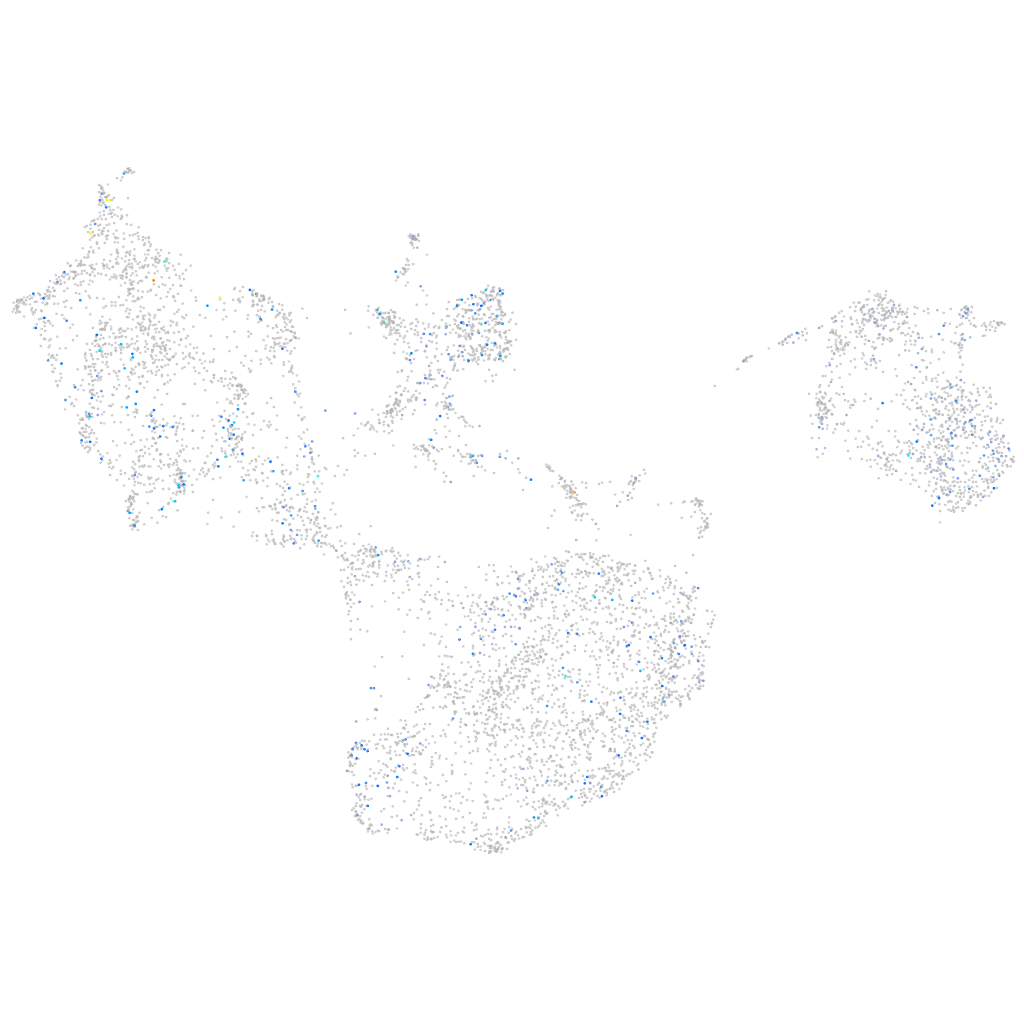
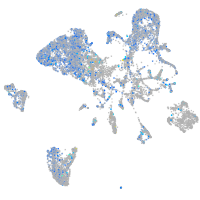
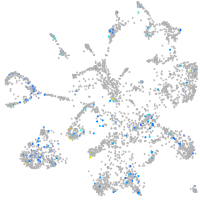
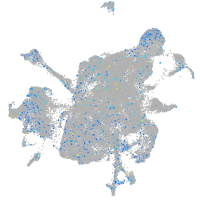
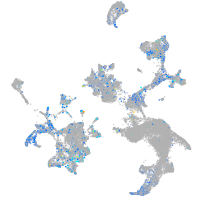
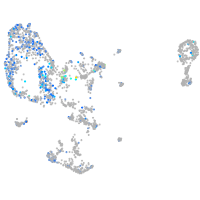
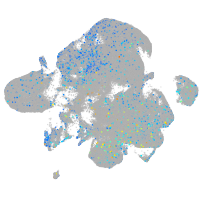
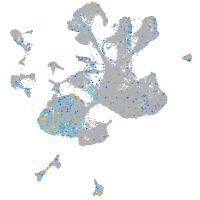
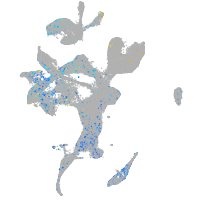
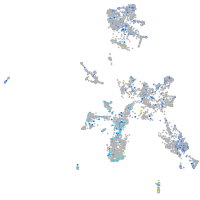
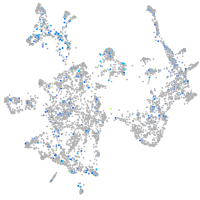
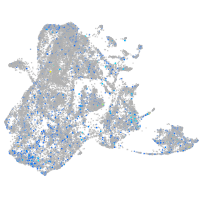
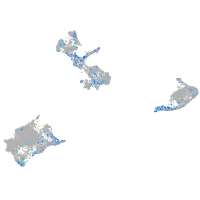
Gene expression UMAP
Display:
Expression
Stage
Other cell groups
all cells
blastomeres
PGCs
endoderm
axial mesoderm
muscle
mural cells /
non-skeletal muscle
mesenchyme
hematopoietic /
vasculature
pronephros
neural
spinal cord / glia
eye
taste / olfactory
otic / lateral line
epidermis
periderm
fin
ionocytes / mucous
pigment cells
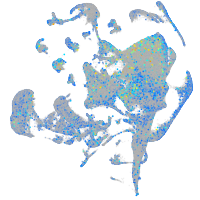
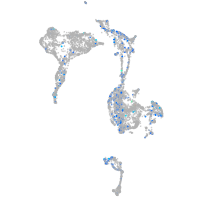
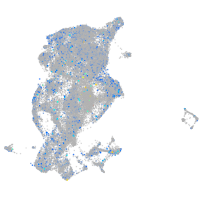
Expression by stage/cluster
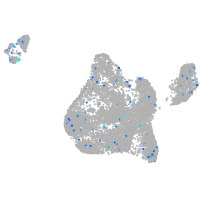
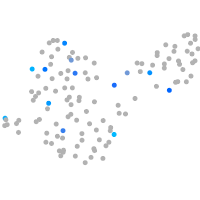
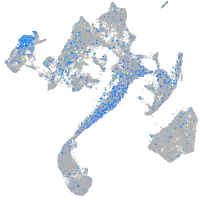
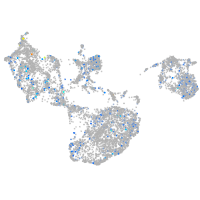
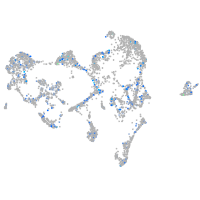
Correlated gene expression
Positive correlation
Negative correlation
Gene
r
Gene
r
rida
0.133
tmsb4x
-0.048
BX548032.1
0.132
and1
-0.047
BX927122.2
0.122
cotl1
-0.039
cyp27a1.2
0.118
ppt1
-0.038
LOC110440123
0.118
pleca
-0.037
diras2
0.116
tmsb1
-0.036
LOC101885611
0.116
thy1
-0.036
CR847936.10
0.114
si:dkey-102c8.3
-0.036
LOC103910825
0.112
arhgef5
-0.036
chrna3
0.112
and2
-0.036
LOC110440222
0.108
s100a10b
-0.035
zgc:114120
0.106
col1a1a
-0.035
mcm6l
0.103
cfl1l
-0.034
nr1d4a
0.102
cldn1
-0.034
si:ch211-157b11.14
0.101
itgb1b.1
-0.033
crygmxl2
0.101
si:rp71-77l1.1
-0.033
si:ch73-44m9.1
0.099
si:dkey-248g15.3
-0.033
LOC103911261
0.098
pfn1
-0.033
map3k7cl
0.094
ak1
-0.032
BX005396.1
0.093
zgc:86896
-0.032
klhdc8a
0.092
ptgdsb.1
-0.032
NC-002333.11
0.092
rpl38
-0.032
ptp4a2a
0.090
zgc:171572
-0.032
si:ch211-168b3.1
0.089
plecb
-0.032
chrm3b
0.087
cyt1
-0.031
slc47a3
0.086
and3
-0.030
XLOC-024206
0.086
cap1
-0.030
sp5l
0.085
col17a1a
-0.030
c1ql4a
0.085
scinla
-0.030
LOC110439533
0.084
DSG2
-0.030
pmm1
0.084
rbp4
-0.029
atpaf1
0.083
myofl
-0.029
XLOC-006197
0.082
col14a1b
-0.029
AL844185.1
0.082
pabpc1b
-0.029
znf1138
0.082
lpcat2
-0.028