Daniocell
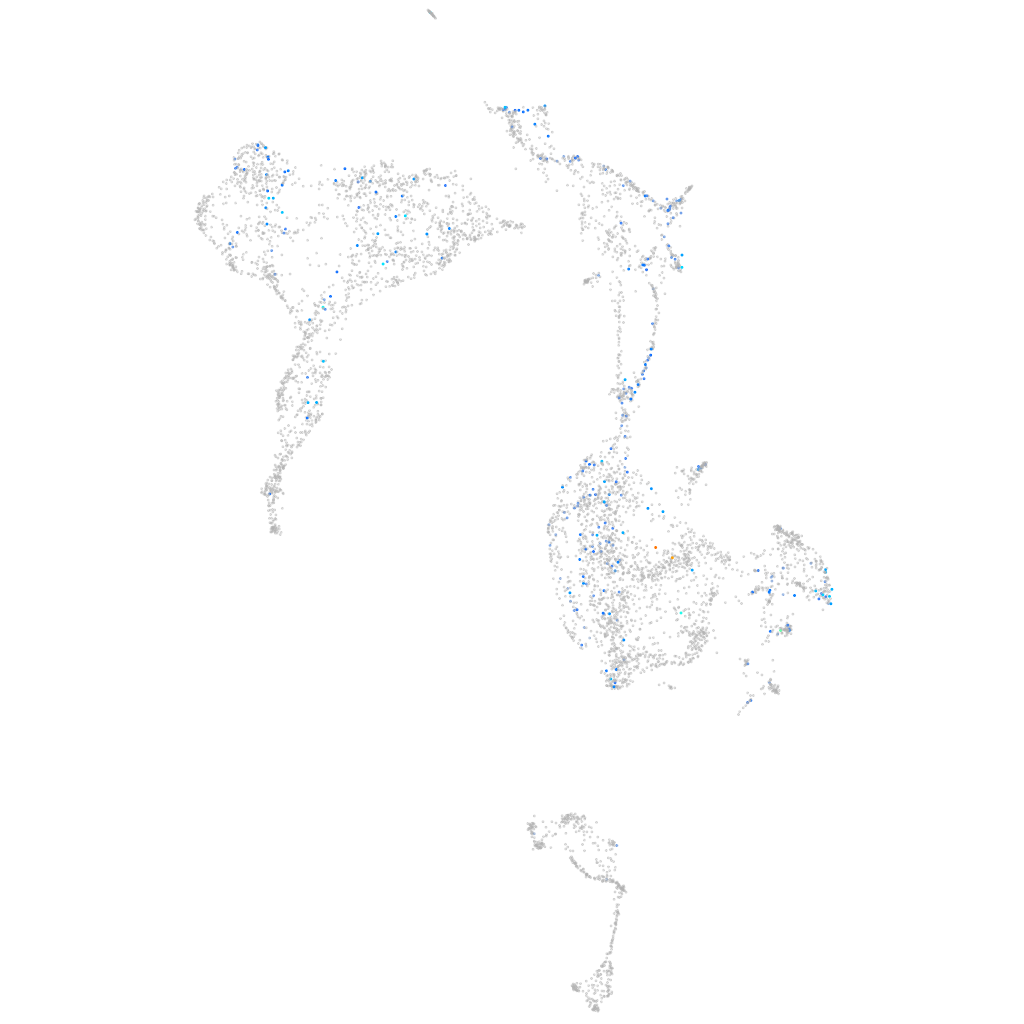
fgfr1b (axial mesoderm)
fibroblast growth factor receptor 1b
ZFIN
Gene expression UMAP
Display:
Expression
Stage
Other cell groups
all cells
blastomeres
PGCs
endoderm
axial mesoderm
muscle
mural cells /
non-skeletal muscle
mesenchyme
hematopoietic /
vasculature
pronephros
neural
spinal cord / glia
eye
taste / olfactory
otic / lateral line
epidermis
periderm
fin
ionocytes / mucous
pigment cells
Expression by stage/cluster
Correlated gene expression
Positive correlation
Negative correlation
Gene
r
Gene
r
trpm2-as
0.222
pitx2
-0.074
LOC101886439
0.145
zgc:174153
-0.065
BX649350.1
0.142
ctslb
-0.064
kcng1
0.132
si:dkey-269i1.4
-0.063
nitr13
0.130
si:dkey-239j18.2
-0.061
FO904880.1
0.127
si:dkey-239j18.3
-0.060
LOC101882866
0.122
klf17
-0.059
si:ch211-263k4.2
0.121
icn
-0.059
cyp1c2
0.120
he1.2
-0.058
zgc:174938
0.113
he1.1
-0.055
gpr22b
0.112
cldnh
-0.055
CU326349.1
0.108
svopl
-0.054
CU024870.1
0.107
si:dkey-269i1.3
-0.052
si:dkey-275b16.2
0.105
malb
-0.051
si:dkeyp-106c3.1
0.105
zgc:92380
-0.051
fam161b
0.104
wu:fa26c03
-0.050
LOC100535347
0.103
LOC108180223
-0.050
CABZ01075068.1
0.101
cldnb
-0.050
usp20
0.100
si:dkey-248g15.3
-0.049
mef2b
0.098
si:dkey-26g8.5
-0.049
igflr1
0.096
timp4.1
-0.048
LOC103910909
0.093
si:dkey-26g8.4
-0.048
zbtb16a
0.093
tmprss9
-0.046
zgc:194392
0.092
s100u
-0.046
fosl1a
0.092
fzd8b
-0.046
XLOC-019960
0.092
krt97
-0.046
si:dkeyp-13d12.23
0.091
sb:cb470
-0.045
si:dkey-1m11.5
0.091
capn2b
-0.045
olfml2bb
0.090
cldn7b
-0.045
tlr4al
0.090
prdm1a
-0.045
junba
0.089
xkr9
-0.044
LOC103908725
0.089
arfgap3
-0.043
hoxa3a
0.089
ckbb
-0.043
XLOC-003690
0.088
stard10
-0.043
mpz
0.087
isl1
-0.043