Daniocell
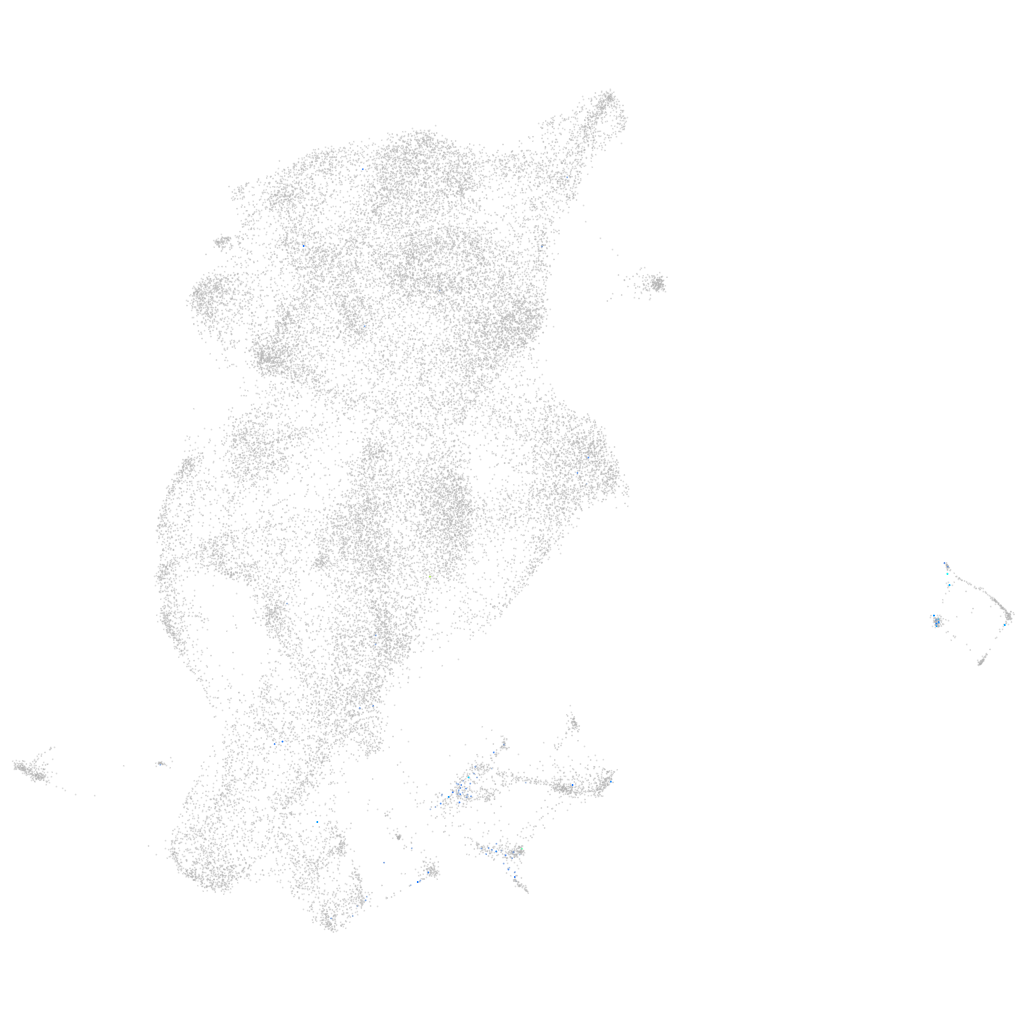
fgfr1b (periderm)
fibroblast growth factor receptor 1b
ZFIN
Gene expression UMAP
Display:
Expression
Stage
Other cell groups
all cells
blastomeres
PGCs
endoderm
axial mesoderm
muscle
mural cells /
non-skeletal muscle
mesenchyme
hematopoietic /
vasculature
pronephros
neural
spinal cord / glia
eye
taste / olfactory
otic / lateral line
epidermis
periderm
fin
ionocytes / mucous
pigment cells
Expression by stage/cluster
Correlated gene expression
Positive correlation
Negative correlation
Gene
r
Gene
r
BX255897.1
0.295
cyt1
-0.085
CR854965.2
0.280
icn2
-0.074
adamts17
0.276
wu:fb18f06
-0.064
CU459174.1
0.270
si:ch211-195b11.3
-0.060
CU469493.1
0.270
krt4
-0.057
mir18a
0.270
rplp2
-0.057
mir19b
0.270
selenow1
-0.056
ush1gb
0.270
icn
-0.052
BX296552.2
0.246
tcnbb
-0.050
BX950868.2
0.229
rpl37
-0.050
XLOC-005124
0.217
rps10
-0.048
PCMTD2
0.215
krtt1c19e
-0.043
vipr1b
0.213
zgc:193505
-0.038
LOC100149647
0.201
zgc:114188
-0.038
si:dkey-1c7.1
0.199
uba52
-0.038
BX927394.1
0.197
ckap4
-0.038
CR855123.1
0.195
cyt1l
-0.038
CABZ01085195.1
0.190
rpl14
-0.038
dsela
0.176
wu:fa03e10
-0.036
tmem174
0.174
rps29
-0.036
si:ch73-138e16.8
0.169
scel
-0.036
BX322661.1
0.166
selenow2b
-0.035
zic2b
0.166
mgst1.2
-0.035
BX072570.1
0.165
rpl35a
-0.035
XLOC-043859
0.165
anxa1a
-0.035
brinp3b
0.164
abcb5
-0.034
BX248515.1
0.160
rpl31
-0.034
BX255913.1
0.158
eef1da
-0.034
zgc:113424
0.156
si:ch211-207n23.2
-0.034
slc22a13a
0.152
rps17
-0.034
inka1a
0.151
cfl1l
-0.033
FO834855.1
0.151
si:dkey-247k7.2
-0.033
sh2d3cb
0.149
rps27a
-0.032
si:dkey-285e18.2
0.149
rpl21
-0.032
olfcg7
0.146
rpl28
-0.032