Daniocell
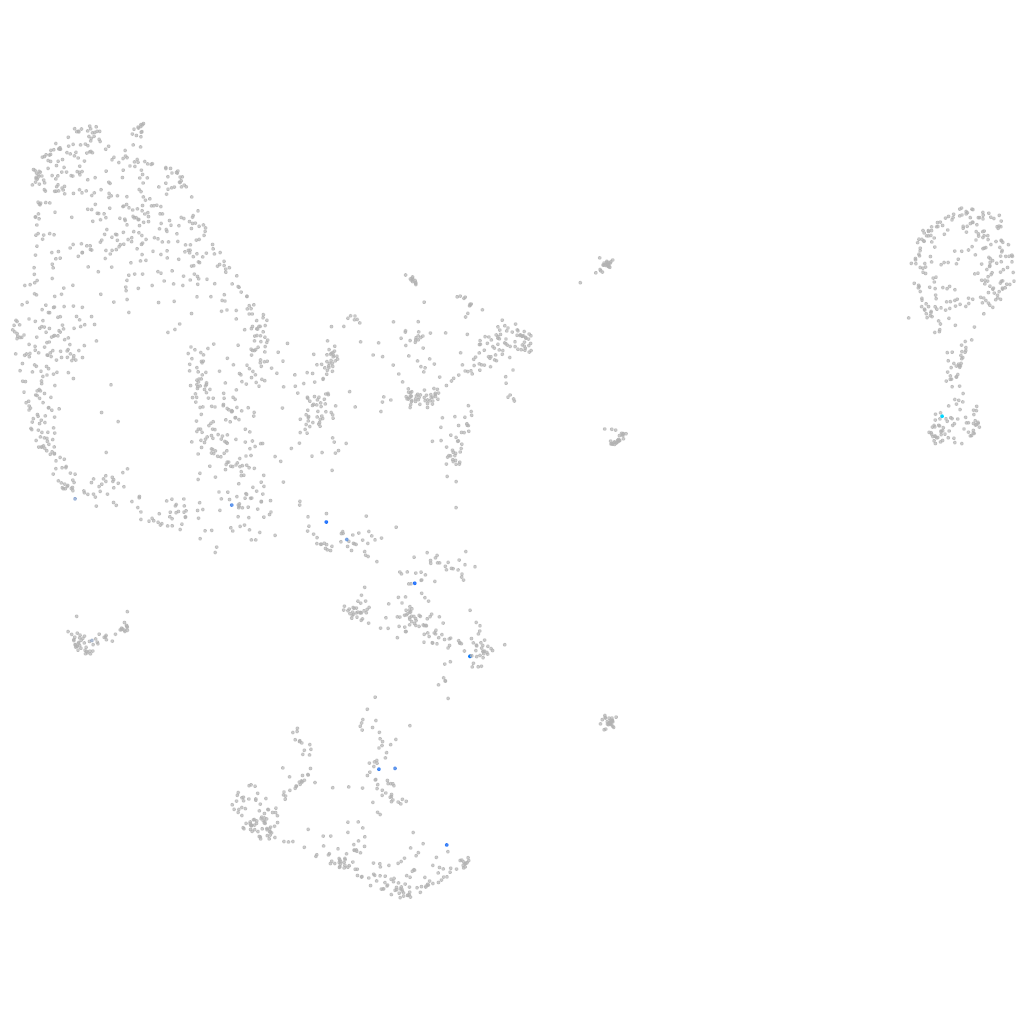
cnksr3 (pronephros)
cnksr family member 3
ZFIN
Gene expression UMAP
Display:
Expression
Stage
Other cell groups
all cells
blastomeres
PGCs
endoderm
axial mesoderm
muscle
mural cells /
non-skeletal muscle
mesenchyme
hematopoietic /
vasculature
pronephros
neural
spinal cord / glia
eye
taste / olfactory
otic / lateral line
epidermis
periderm
fin
ionocytes / mucous
pigment cells
Expression by stage/cluster
Correlated gene expression
Positive correlation
Negative correlation
Gene
r
Gene
r
XLOC-043106
0.650
sod1
-0.055
tiam2b
0.650
mt-nd3
-0.055
actn2a
0.630
eef1da
-0.052
LOC100332698
0.602
aldob
-0.051
LOC103908899
0.579
gapdh
-0.049
sat2a
0.577
cox6a2
-0.048
CU915827.1
0.499
gstr
-0.047
pimr209
0.477
ahcy
-0.047
LOC103909940
0.434
gcshb
-0.046
BX088525.2
0.358
si:ch211-139a5.9
-0.046
cap2
0.327
ost4
-0.045
znf1068
0.314
si:dkey-16p21.8
-0.045
tnfrsf1b
0.299
adh8b
-0.043
LOC556170
0.296
pvalb1
-0.043
si:dkey-37o8.1
0.293
alpl
-0.043
taar20w
0.293
cubn
-0.043
XLOC-043073
0.291
akt2l
-0.043
zgc:111868
0.287
pvalb2
-0.041
CABZ01009511.1
0.287
cebpd
-0.041
she
0.276
rgrb
-0.041
etv6
0.267
hao1
-0.041
LOC101885664
0.265
fbp1b
-0.041
dpep2
0.263
si:dkey-33i11.9
-0.040
si:dkey-6f10.4
0.259
upb1
-0.040
si:dkeyp-35e5.10
0.248
nit2
-0.040
snai2
0.242
gstt1a
-0.039
FP102169.1
0.239
phyhd1
-0.039
LOC101882703
0.235
cox17
-0.039
si:dkey-237m9.2
0.229
pdzk1ip1
-0.039
LOC100334368
0.226
slc26a1
-0.039
RF01268
0.226
hoga1
-0.039
grin2da
0.225
tspan36
-0.038
si:ch211-223a21.1
0.224
ubqln4
-0.038
LOC100333111
0.223
amt
-0.038
ZNF276
0.223
nipsnap3a
-0.038