Daniocell
cnksr3 (fin)
cnksr family member 3
ZFIN
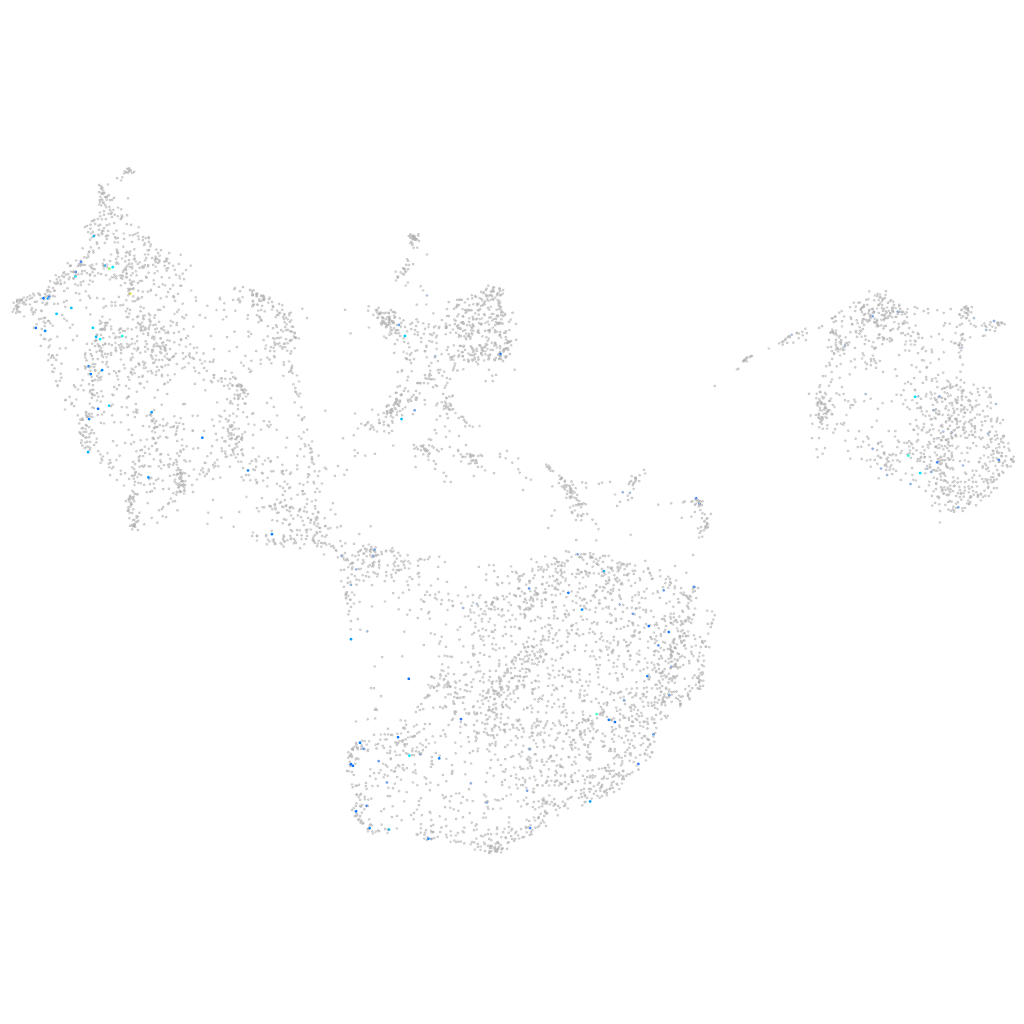
Gene expression UMAP
Display:
Expression
Stage
Other cell groups
all cells
blastomeres
PGCs
endoderm
axial mesoderm
muscle
mural cells /
non-skeletal muscle
mesenchyme
hematopoietic /
vasculature
pronephros
neural
spinal cord / glia
eye
taste / olfactory
otic / lateral line
epidermis
periderm
fin
ionocytes / mucous
pigment cells
Expression by stage/cluster
Correlated gene expression
Positive correlation
Negative correlation
Gene
r
Gene
r
znfl1h
0.173
foxp4
-0.041
lhcgr
0.160
eef1da
-0.039
LOC108190755
0.150
gtpbp4
-0.038
si:dkey-27l15.1
0.149
fdx1
-0.036
si:ch211-205a14.3
0.149
si:dkey-151g10.6
-0.035
tiam2b
0.146
ptmaa
-0.034
zgc:154125
0.133
tmod2
-0.033
XLOC-042488
0.133
fxyd6l
-0.033
BX510992.2
0.127
rpa3
-0.032
XLOC-007147
0.126
pycard
-0.032
LOC110440109
0.125
tfpia
-0.032
nostrin
0.124
rbp4
-0.031
BX530024.1
0.123
mat2aa
-0.031
ngs
0.119
eif4a1b
-0.031
XLOC-002540
0.116
rpl36a
-0.030
LOC103911884
0.116
mrpl45
-0.030
CABZ01058647.1
0.115
sub1b
-0.030
p2rx5
0.114
krt91
-0.030
slc7a9
0.114
si:dkey-33c14.3
-0.030
LOC100535496
0.112
gapdhs
-0.030
LOC100537504
0.109
banf1
-0.029
entpd2b
0.109
nup62l
-0.029
cpne5a
0.106
si:dkey-16p21.8
-0.029
si:ch211-255a21.2
0.106
eif2s1b
-0.029
pabpn1l
0.104
si:ch73-173h19.3
-0.029
FO834800.2
0.104
metap2b
-0.029
LOC100536609
0.102
fosb
-0.029
uckl1a
0.101
rpl27a
-0.028
LOC108182684
0.100
rsl1d1
-0.028
nkx1.2la
0.100
eef2b
-0.028
CR936977.1
0.099
plk2a
-0.028
CU019647.1
0.097
itm2bb
-0.028
si:ch73-122g19.1
0.097
cotl1
-0.028
pcdh2g7
0.097
si:ch211-156b7.4
-0.028
l3mbtl4
0.096
col1a2
-0.027