Daniocell
cnksr3 (taste / olfactory)
cnksr family member 3
ZFIN
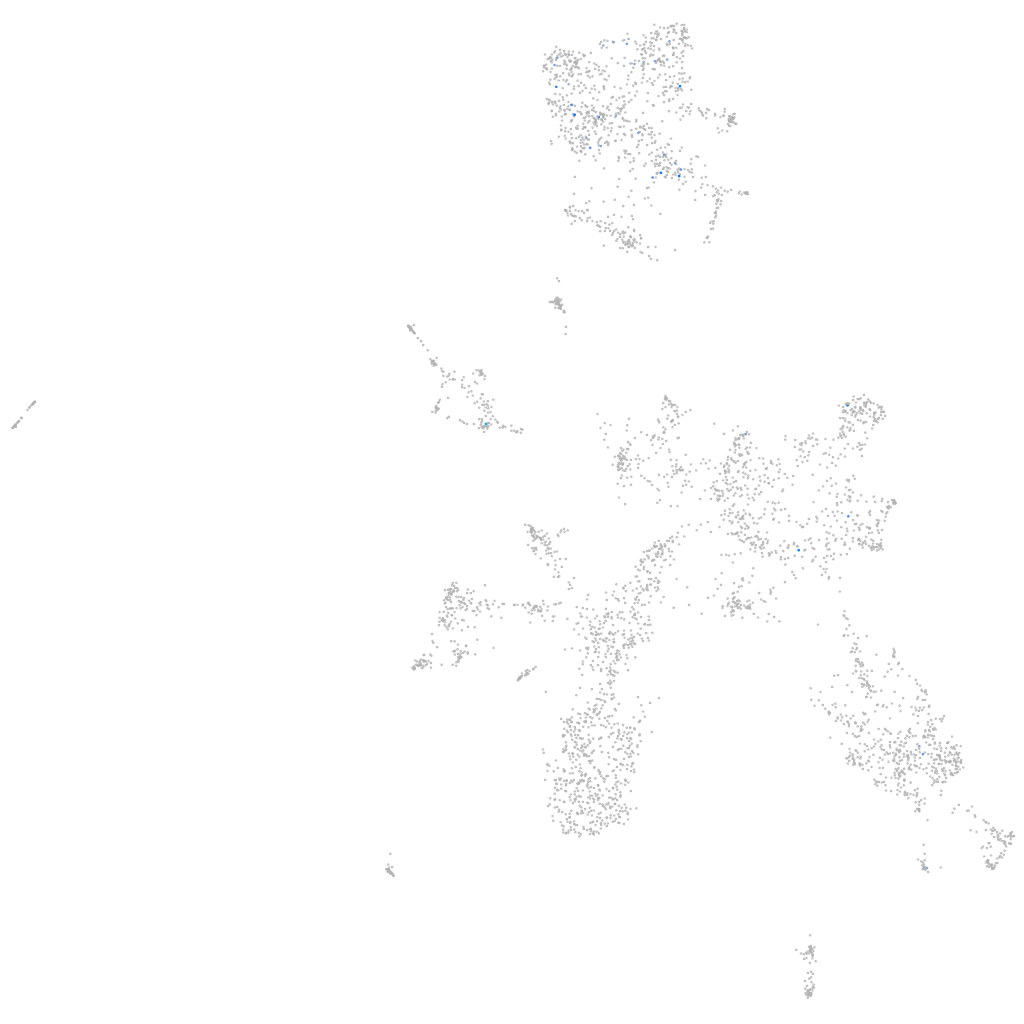
Gene expression UMAP
Display:
Expression
Stage
Other cell groups
all cells
blastomeres
PGCs
endoderm
axial mesoderm
muscle
mural cells /
non-skeletal muscle
mesenchyme
hematopoietic /
vasculature
pronephros
neural
spinal cord / glia
eye
taste / olfactory
otic / lateral line
epidermis
periderm
fin
ionocytes / mucous
pigment cells
Expression by stage/cluster
Correlated gene expression
Positive correlation
Negative correlation
Gene
r
Gene
r
uts2b
0.387
elavl3
-0.068
CABZ01065684.1
0.387
stmn1b
-0.060
BX544876.1
0.349
tuba1a
-0.058
RF00413
0.247
si:ch211-153b23.5
-0.056
CABZ01046997.1
0.234
tmsb
-0.055
BX324006.1
0.204
tspan2a
-0.055
zgc:172065
0.196
si:dkey-276j7.1
-0.054
LOC103912005
0.190
pvalb5
-0.053
nceh1a
0.156
atf5a
-0.051
CR677513.1
0.152
insm1a
-0.051
hrasls
0.152
zgc:65894
-0.051
si:dkeyp-75b4.8
0.152
rtn1a
-0.051
si:dkey-103e21.5
0.145
vdac3
-0.050
BX088712.1
0.140
gng3
-0.050
trim35-1
0.137
adcyap1b
-0.050
CR925798.1
0.135
scg2b
-0.050
LOC108191789
0.134
si:dkeyp-75h12.5
-0.049
FP016142.5
0.134
LOC100537342
-0.048
ptpdc1b
0.133
ebf3a
-0.047
gja8b
0.132
olfm1b
-0.047
tac3b
0.130
chga
-0.047
kif13bb
0.129
tmeff1b
-0.046
LOC110438837
0.127
gnao1a
-0.046
si:dkey-28d5.8
0.127
zc4h2
-0.045
CU657925.1
0.127
si:ch211-10a23.2
-0.045
BX936393.2
0.125
sub1b
-0.045
METTL21C
0.125
calm2a
-0.045
zgc:154046
0.123
fstl5
-0.044
hsd17b3
0.123
gnao1b
-0.044
timp4.3
0.121
pde6d
-0.044
myo10
0.120
fthl31
-0.044
pnrc1
0.119
atp6v0cb
-0.043
LOC108180344
0.119
si:ch211-237l4.6
-0.043
SLC5A10
0.117
sub1a
-0.043
CR848784.3
0.116
enkur
-0.042