Daniocell
bloc1s2 (blastomeres)
"biogenesis of lysosomal organelles complex-1, subunit 2"
ZFIN
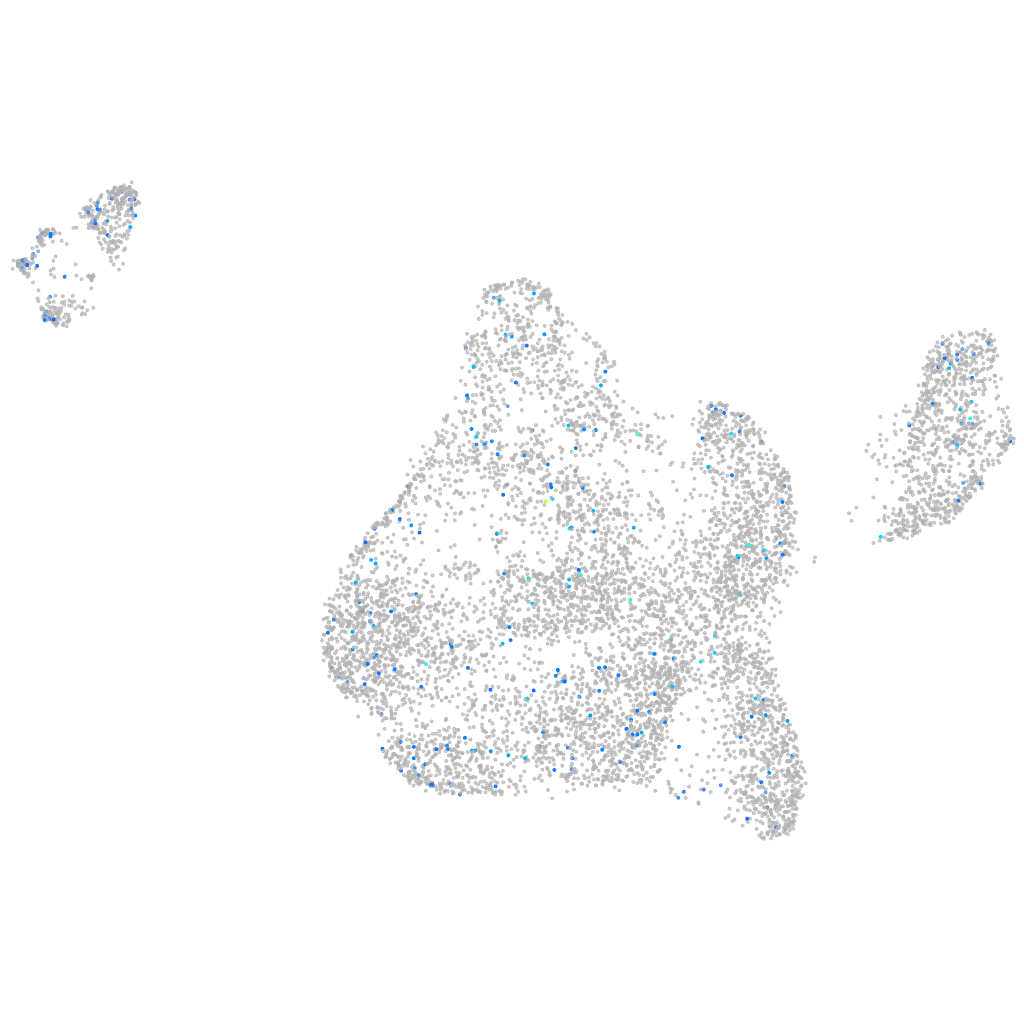
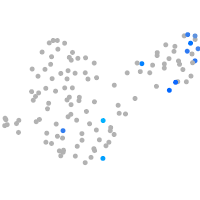
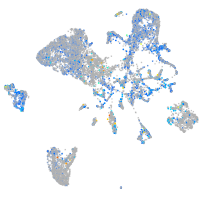
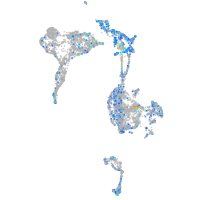
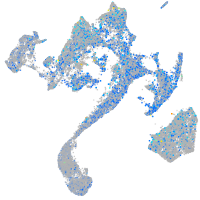
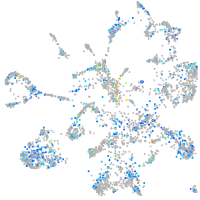
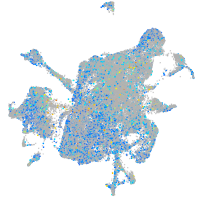
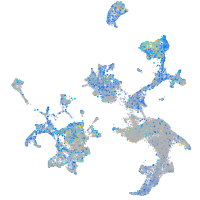
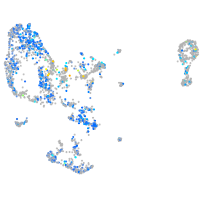
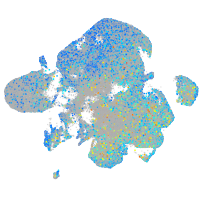
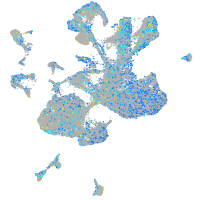
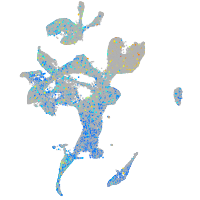
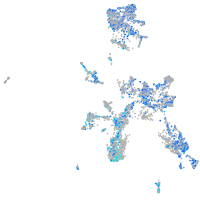
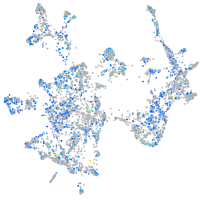
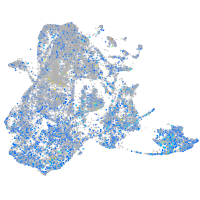
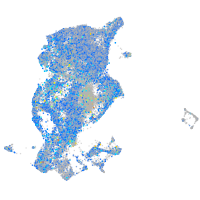
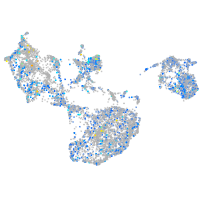
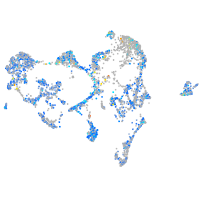
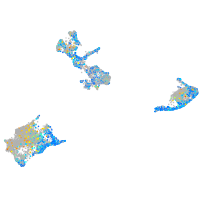
Gene expression UMAP
Display:
Expression
Stage
Other cell groups
all cells
blastomeres
PGCs
endoderm
axial mesoderm
muscle
mural cells /
non-skeletal muscle
mesenchyme
hematopoietic /
vasculature
pronephros
neural
spinal cord / glia
eye
taste / olfactory
otic / lateral line
epidermis
periderm
fin
ionocytes / mucous
pigment cells
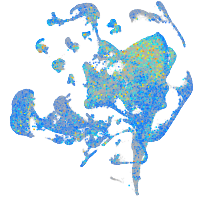
Expression by stage/cluster
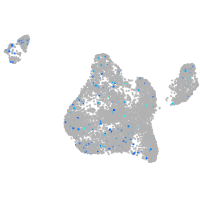
Correlated gene expression
Positive correlation
Negative correlation
Gene
r
Gene
r
XLOC-032630
0.130
stm
-0.063
FP085398.1
0.118
si:ch211-152c2.3
-0.044
grxcr2
0.108
aldob
-0.043
dnai2b
0.107
marcksl1b
-0.041
sgcg
0.106
si:ch73-1a9.3
-0.039
LOC110439879
0.101
hnrnpa0b
-0.038
si:dkey-56m15.9
0.100
mcm6
-0.038
CR392001.4
0.099
hspb1
-0.038
XLOC-026839
0.091
akap12b
-0.036
CR388228.1
0.089
dynll1
-0.036
LOC101882073
0.087
cbx3a
-0.033
LOC558721
0.086
rpl26
-0.033
hbbe1.1
0.083
ccnd1
-0.033
LOC103909067
0.083
hnrnpa0a
-0.033
RF00016
0.079
anp32e
-0.032
BX005254.2
0.079
hmga1a
-0.031
spink4
0.078
akap8l
-0.030
ctslb
0.077
ncl
-0.030
si:ch73-383g2.1
0.076
BX088707.1
-0.030
BX927243.2
0.075
hmgb2a
-0.030
optc
0.075
tbx16
-0.029
si:ch211-216b21.2
0.074
her8a
-0.028
aire
0.073
si:dkey-92i17.2
-0.028
CR925728.2
0.072
srsf5a
-0.028
XLOC-034525
0.071
cx43.4
-0.027
si:dkey-28d5.4
0.070
pak1
-0.027
si:ch211-229i14.2
0.067
ccne2
-0.027
klhl31
0.067
cox7c
-0.027
iffo2a
0.067
id1
-0.027
lrrc34
0.066
nip7
-0.027
kif28
0.065
rps21
-0.026
XLOC-026705
0.065
rplp0
-0.026
XLOC-010795
0.064
kif26ab
-0.026
vtg3
0.064
rhoab
-0.026
XLOC-003625
0.064
hmgn6
-0.025