Daniocell
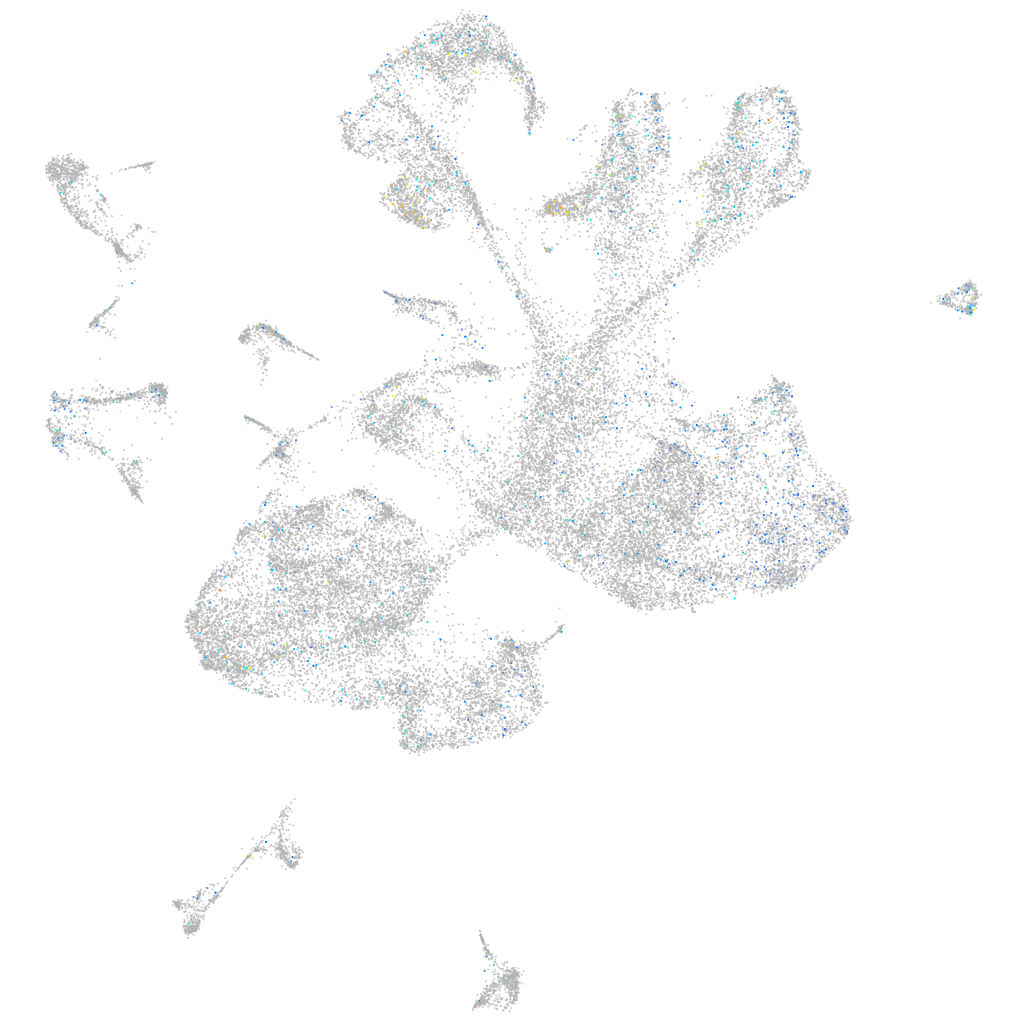
znf971 (glial cells / spinal cord)
zinc finger protein 971
ZFIN
Gene expression UMAP
Display:
Expression
Stage
Other cell groups
all cells
blastomeres
PGCs
endoderm
axial mesoderm
muscle
mural cells /
non-skeletal muscle
mesenchyme
hematopoietic /
vasculature
pronephros
neural
spinal cord / glia
eye
taste / olfactory
otic / lateral line
epidermis
periderm
fin
ionocytes / mucous
pigment cells
Expression by stage/cluster
Correlated gene expression
Positive correlation
Negative correlation
Gene
r
Gene
r
CR792454.1
0.069
mdka
-0.043
LOC101885413
0.066
si:ch73-21g5.7
-0.039
si:ch73-205h11.1
0.061
eef1b2
-0.038
LOC108183851
0.061
fabp3
-0.038
LOC101882928
0.059
her15.1
-0.038
snap25a
0.059
pax3a
-0.036
sncb
0.055
actb2
-0.035
tm4sf5
0.053
XLOC-003689
-0.035
gng3
0.053
notch3
-0.035
LOC108191970
0.052
rplp1
-0.035
tuba2
0.052
rpl29
-0.034
si:cabz01009626.1
0.052
rps29
-0.034
tmc4
0.051
her4.2
-0.033
si:ch73-236c18.2.1
0.051
slc1a3a
-0.033
si:ch211-205a14.1
0.050
rplp2l
-0.032
atp6v0cb
0.050
top1l
-0.032
zgc:65894
0.049
gas1b
-0.031
dpyda.3
0.049
gpm6bb
-0.031
rtn1b
0.049
LOC798783
-0.030
elavl4
0.048
rps12
-0.030
daw1
0.048
boc
-0.030
si:ch211-195b15.8
0.047
id1
-0.030
stmn4l
0.047
dla
-0.030
gpr85
0.047
zgc:165461
-0.030
si:dkeyp-72g9.4
0.047
rpl14
-0.030
calm2a
0.047
si:dkey-151g10.6
-0.030
lrrc4bb
0.047
rps28
-0.029
tmem59l
0.046
actb1
-0.029
syn2a
0.046
eef1a1l1
-0.029
csdc2a
0.046
btg2
-0.028
si:ch73-6k14.2
0.046
XLOC-003690
-0.028
vamp2
0.046
notch1a
-0.028
themis
0.046
rps10
-0.028
scg2b
0.046
hmgb2a
-0.028
olfm1b
0.046
si:ch211-57n23.4
-0.028