Daniocell
znf971 (blastomeres)
zinc finger protein 971
ZFIN
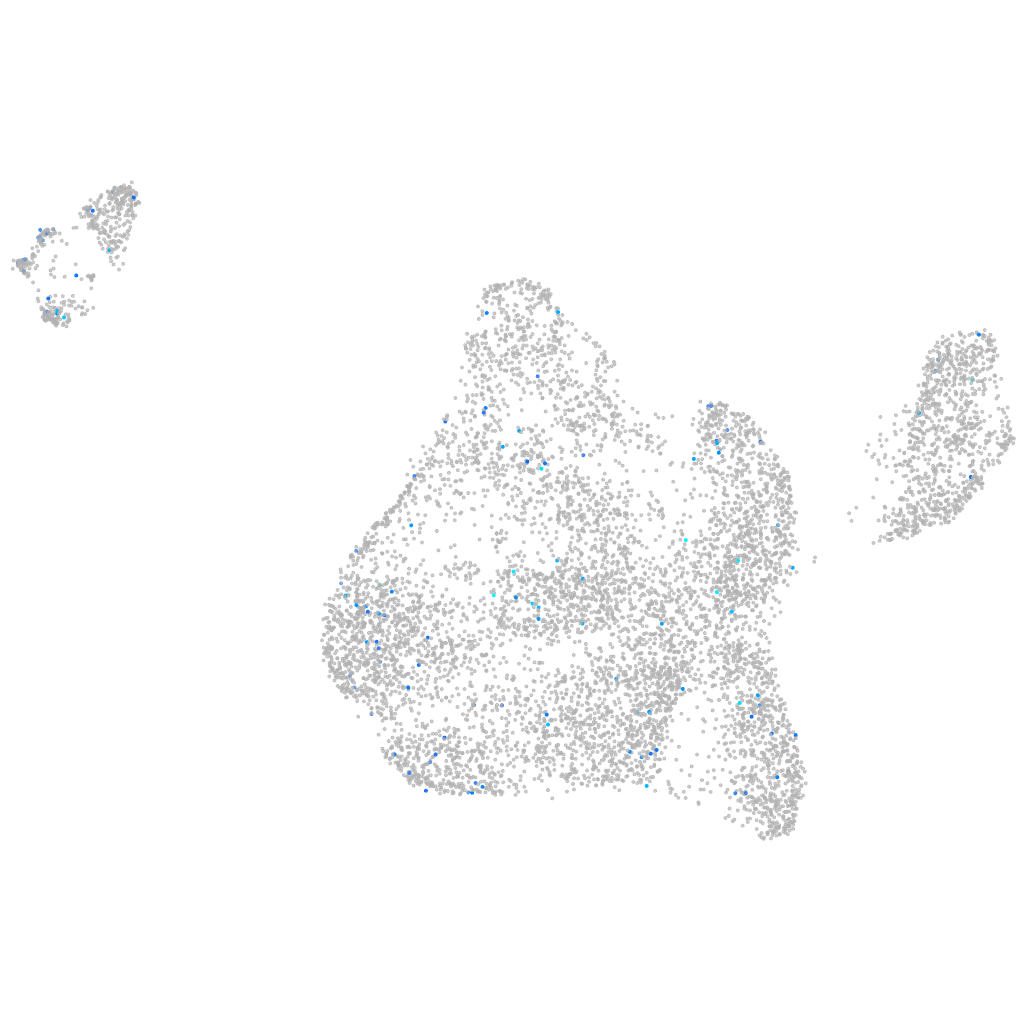
Gene expression UMAP
Display:
Expression
Stage
Other cell groups
all cells
blastomeres
PGCs
endoderm
axial mesoderm
muscle
mural cells /
non-skeletal muscle
mesenchyme
hematopoietic /
vasculature
pronephros
neural
spinal cord / glia
eye
taste / olfactory
otic / lateral line
epidermis
periderm
fin
ionocytes / mucous
pigment cells
Expression by stage/cluster
Correlated gene expression
Positive correlation
Negative correlation
Gene
r
Gene
r
LOC100331417
0.146
si:dkey-151g10.6
-0.038
FP016247.2
0.146
actb2
-0.035
fam131bb
0.135
si:ch73-1a9.3
-0.034
elovl8a
0.120
hmga1a
-0.034
CU466285.1
0.119
rpl22
-0.034
cbln14
0.114
cst3
-0.032
pdk2b
0.114
kpna3
-0.031
bsna
0.105
ppm1g
-0.031
LOC110438093
0.105
cdc26
-0.031
SLC35D3
0.105
eif4ba
-0.030
LOC101882067
0.101
tcea1
-0.030
XLOC-005350
0.100
tomm5
-0.029
si:ch211-1f22.2
0.100
DDX17
-0.029
LOC100537963
0.099
marcksl1b
-0.028
mhc1uba
0.099
sf3a2
-0.028
wnt3a
0.099
stm
-0.028
CR377211.4
0.096
CR383676.1
-0.027
LOC101885947
0.094
hes6
-0.027
AL935144.1
0.093
dnajc11a
-0.027
gpr61l
0.092
psma1
-0.026
gng13b
0.090
rps28
-0.026
XLOC-013065
0.089
cirbpb
-0.025
plk2a
0.088
arg2
-0.025
cracr2ab
0.088
LOC108180286
-0.025
mfsd7
0.084
mcm6
-0.025
XLOC-037388
0.083
XLOC-042263
-0.025
foxe3
0.083
leo1
-0.025
si:dkeyp-123a12.2
0.083
ftr82
-0.024
si:ch211-113j14.1
0.082
gdi2
-0.024
LOC570723
0.082
rps27.2
-0.024
def6b
0.081
vox
-0.024
cfhl1
0.080
ptdss2
-0.024
CR753902.1
0.079
rpl23
-0.024
CR847870.1
0.077
psma2
-0.024
LOC108179784
0.076
selenow1
-0.024