Daniocell
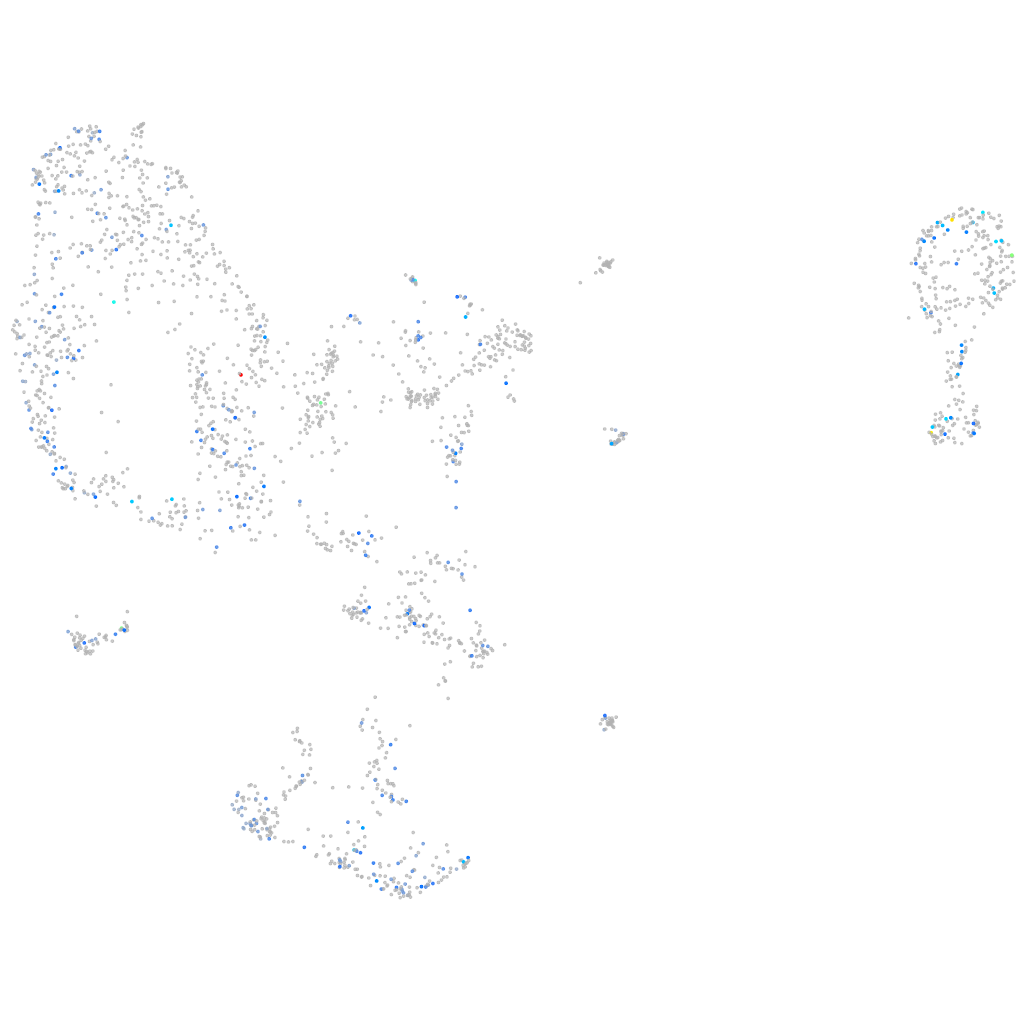
zgc:92107 (pronephros)
zgc:92107
ZFIN
Gene expression UMAP
Display:
Expression
Stage
Other cell groups
all cells
blastomeres
PGCs
endoderm
axial mesoderm
muscle
mural cells /
non-skeletal muscle
mesenchyme
hematopoietic /
vasculature
pronephros
neural
spinal cord / glia
eye
taste / olfactory
otic / lateral line
epidermis
periderm
fin
ionocytes / mucous
pigment cells
Expression by stage/cluster
Correlated gene expression
Positive correlation
Negative correlation
Gene
r
Gene
r
LOC110438144
0.319
rps9
-0.093
efcc1
0.259
rpl23
-0.089
fhdc4
0.240
rps23
-0.084
mhc1zea
0.217
nit2
-0.077
jag1a
0.213
rpl18
-0.075
LOC108183960
0.211
rpl21
-0.071
si:ch211-106h11.3
0.203
rplp0
-0.071
zgc:158689
0.196
atp6v1e1b
-0.071
BX950205.1
0.194
rps17
-0.070
pax3a
0.191
rps10
-0.069
LOC108180223
0.188
rps20
-0.069
si:busm1-104n07.3
0.168
rpl12
-0.069
si:dkey-73p2.2
0.158
si:dkey-151g10.6
-0.069
zcchc7
0.154
rpl39
-0.068
lrrc29
0.153
zgc:101858
-0.067
ccdc50
0.152
zgc:114188
-0.066
tmem259
0.150
rpl37
-0.066
rab33ba
0.147
cox5aa
-0.065
LO017718.1
0.147
rpl28
-0.064
XLOC-002816
0.147
acy3.2
-0.063
gpr161
0.147
snx2
-0.063
vegfbb
0.146
atp5pb
-0.063
alms1
0.145
aqp8b
-0.062
CABZ01059408.1
0.144
hbae1.1
-0.062
si:dkey-259j3.5
0.143
snx8a
-0.061
si:dkey-240h12.4
0.142
si:dkey-103j14.5
-0.060
LO017816.1
0.142
cox6b2
-0.059
metrnlb
0.142
tpi1b
-0.059
col6a1
0.141
stmn1b
-0.059
LOC101884298
0.139
hbae3
-0.058
chm
0.138
gcshb
-0.058
hoxc6a
0.136
prdx2
-0.057
nf2a
0.136
slc20a1a
-0.057
CU571069.1
0.136
hnrnpa0l
-0.057
CU655820.1
0.135
hbbe1.3
-0.057