Daniocell
zgc:174696 (taste / olfactory)
zgc:174696
ZFIN
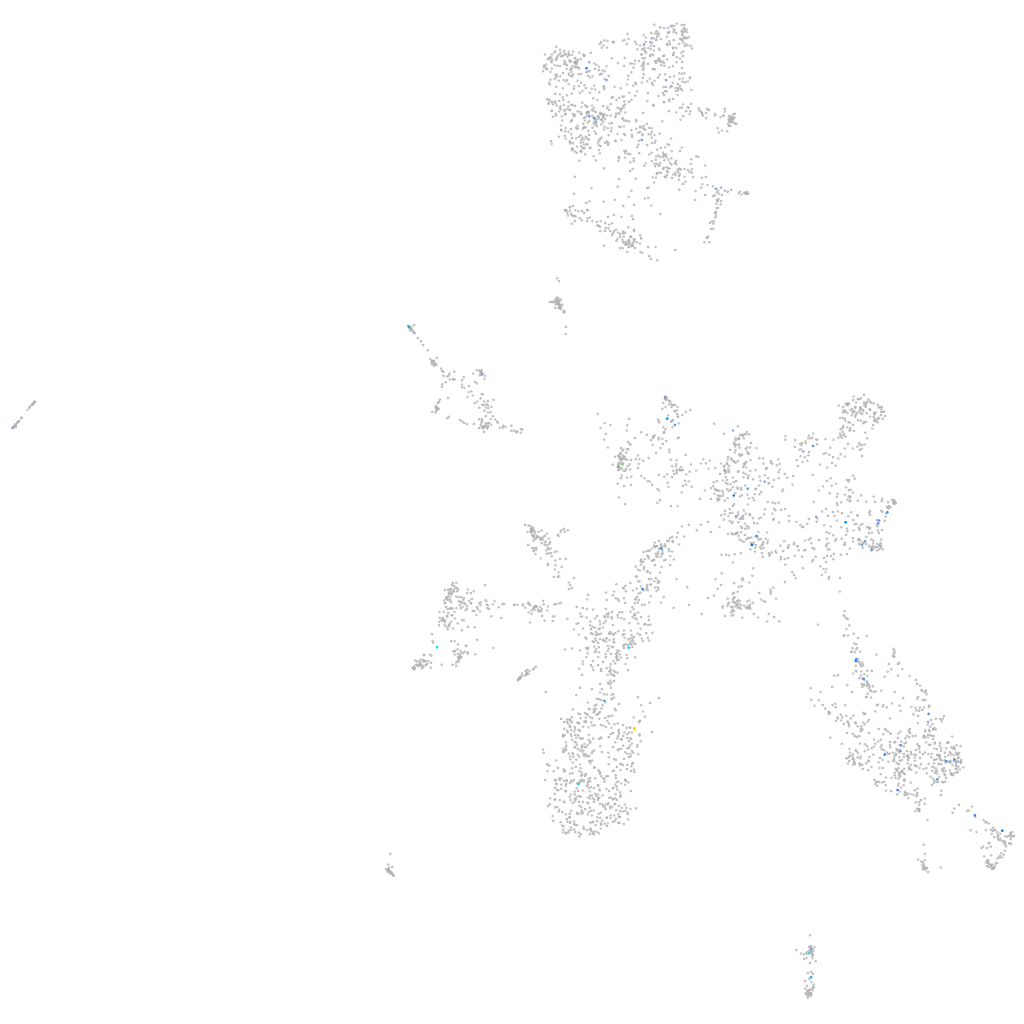
Gene expression UMAP
Display:
Expression
Stage
Other cell groups
all cells
blastomeres
PGCs
endoderm
axial mesoderm
muscle
mural cells /
non-skeletal muscle
mesenchyme
hematopoietic /
vasculature
pronephros
neural
spinal cord / glia
eye
taste / olfactory
otic / lateral line
epidermis
periderm
fin
ionocytes / mucous
pigment cells
Expression by stage/cluster
Correlated gene expression
Positive correlation
Negative correlation
Gene
r
Gene
r
tacr3a
0.280
actc1b
-0.050
FP103005.1
0.278
bik
-0.045
CT009597.1
0.271
tprg1
-0.042
sema3h
0.261
tnnt3b
-0.040
hs3st1l1
0.260
mgst3a
-0.039
XLOC-017895
0.229
rnf130
-0.036
BX649423.2
0.225
acadvl
-0.035
LOC101884469
0.214
eef1b2
-0.034
drd1a
0.214
csnk1db
-0.034
LOC108182317
0.204
lsm4
-0.034
si:dkey-28o19.1
0.199
clcn4
-0.033
LOC103909565
0.195
vgf
-0.033
irx5b
0.193
si:ch73-376l24.3
-0.032
LOC101887002
0.189
si:rp71-45k5.4
-0.032
phlpp2
0.181
ift20
-0.032
LOC101883804
0.176
icn
-0.031
si:ch211-106h4.4
0.175
mgaa
-0.031
BX649313.1
0.174
tmed1b
-0.031
BX784029.3
0.174
nfkbib
-0.031
MFN1
0.172
nsa2
-0.031
si:dkey-24p1.1
0.168
zgc:92380
-0.031
znf1039
0.164
rnasekb
-0.031
si:ch73-364h19.2
0.164
sept7a
-0.031
foxb1b
0.162
soga1
-0.030
foxg1d
0.161
march8
-0.030
drd5a
0.158
creld1b
-0.030
or104-2
0.157
pvalb2
-0.030
LOC108182486
0.156
wu:fb18f06
-0.030
MINAR1
0.156
tspan35
-0.030
CT573133.1
0.156
ppp1r12a
-0.030
camkva
0.155
rasd3
-0.030
CU326366.2
0.151
chd4b
-0.029
CR932000.1
0.150
si:ch1073-443f11.2
-0.029
zbtb40
0.147
prelid3b
-0.029
RF00231
0.147
uvssa
-0.029