Daniocell
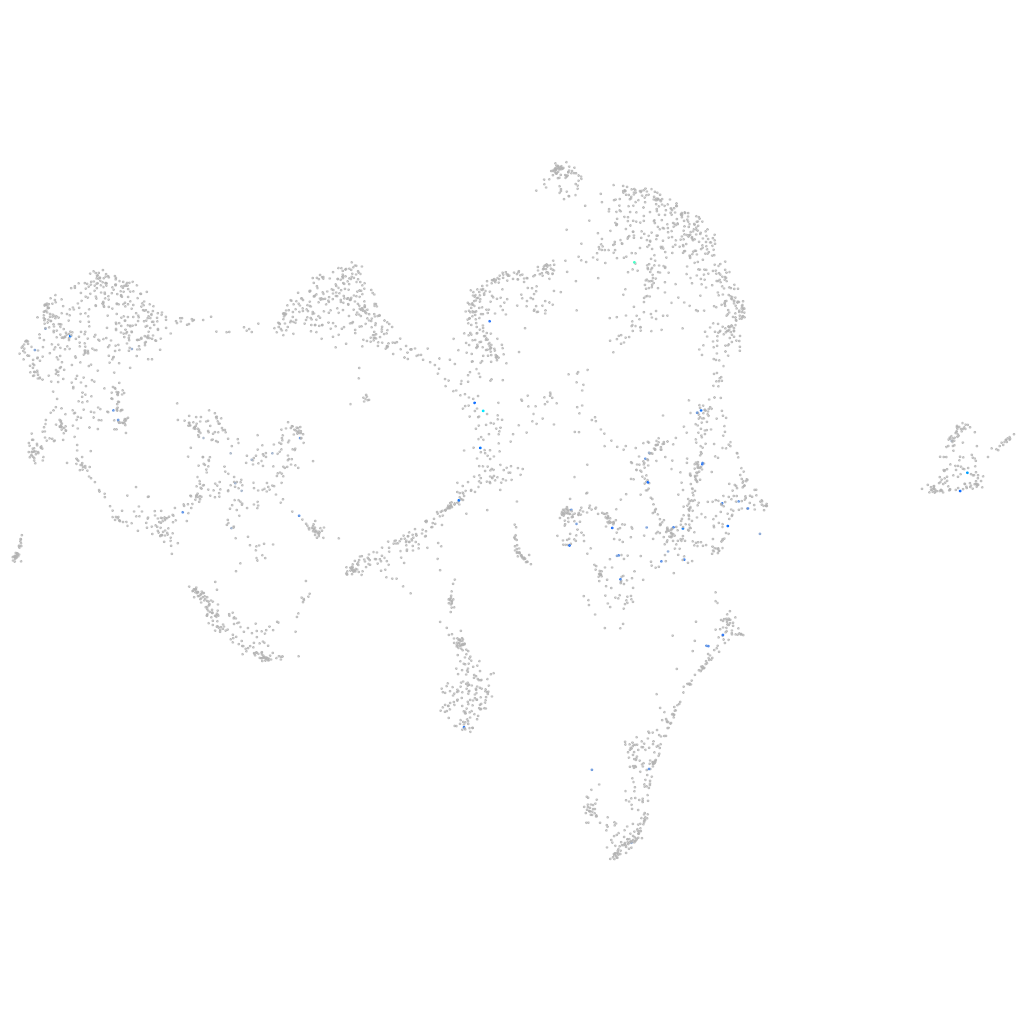
zgc:174696 (ionocytes / mucous-producing)
zgc:174696
ZFIN
Gene expression UMAP
Display:
Expression
Stage
Other cell groups
all cells
blastomeres
PGCs
endoderm
axial mesoderm
muscle
mural cells /
non-skeletal muscle
mesenchyme
hematopoietic /
vasculature
pronephros
neural
spinal cord / glia
eye
taste / olfactory
otic / lateral line
epidermis
periderm
fin
ionocytes / mucous
pigment cells
Expression by stage/cluster
Correlated gene expression
Positive correlation
Negative correlation
Gene
r
Gene
r
LOC108183600
0.333
cst14b.1
-0.061
LOC101885430
0.280
BX000438.2
-0.055
pak7
0.263
soul2
-0.048
XLOC-026937
0.204
hdlbpa
-0.048
LOC103908767
0.196
tdh
-0.047
nefmb
0.195
selenow2b
-0.047
fut9a
0.193
ppl
-0.046
nampta
0.188
si:ch211-195b11.3
-0.046
cers6
0.188
LOC799574
-0.045
BX901962.2
0.183
wu:fb18f06
-0.045
apnl
0.180
aldob
-0.045
znf1038
0.177
selenow1
-0.044
LOC110439987
0.177
ahnak
-0.044
si:dkey-22h13.3
0.175
mgst1.2
-0.043
si:dkey-45d16.4
0.173
ildr1a
-0.043
cyp4v8
0.173
fuca2
-0.042
znf992
0.170
zgc:110333
-0.042
slc12a4
0.169
XLOC-043857
-0.042
CU151886.1
0.165
akap9
-0.042
PLEKHB1
0.163
zgc:123295
-0.042
CU062501.1
0.163
DSG2
-0.042
acyp2
0.162
mpc1
-0.041
rasl11a
0.158
gsto2
-0.040
LOC101885301
0.158
wu:fi04e12
-0.039
LOC110439805
0.156
serpinb1l3
-0.039
dpysl5b
0.155
vamp8
-0.039
klhl26
0.154
tmem45b
-0.039
ccl39.3
0.154
atp1a1a.2
-0.039
znf1083
0.149
cxadr
-0.038
col4a2
0.144
tmsb1
-0.038
CT956066.1
0.143
mgst3a
-0.038
rnd3b
0.141
gadd45ba
-0.038
si:dkey-100n19.2
0.137
nbr1a
-0.038
XLOC-029389
0.136
tpd52l2a
-0.038
LOC103909874
0.135
gstp1
-0.037