Daniocell
zgc:174696 (eye)
zgc:174696
ZFIN
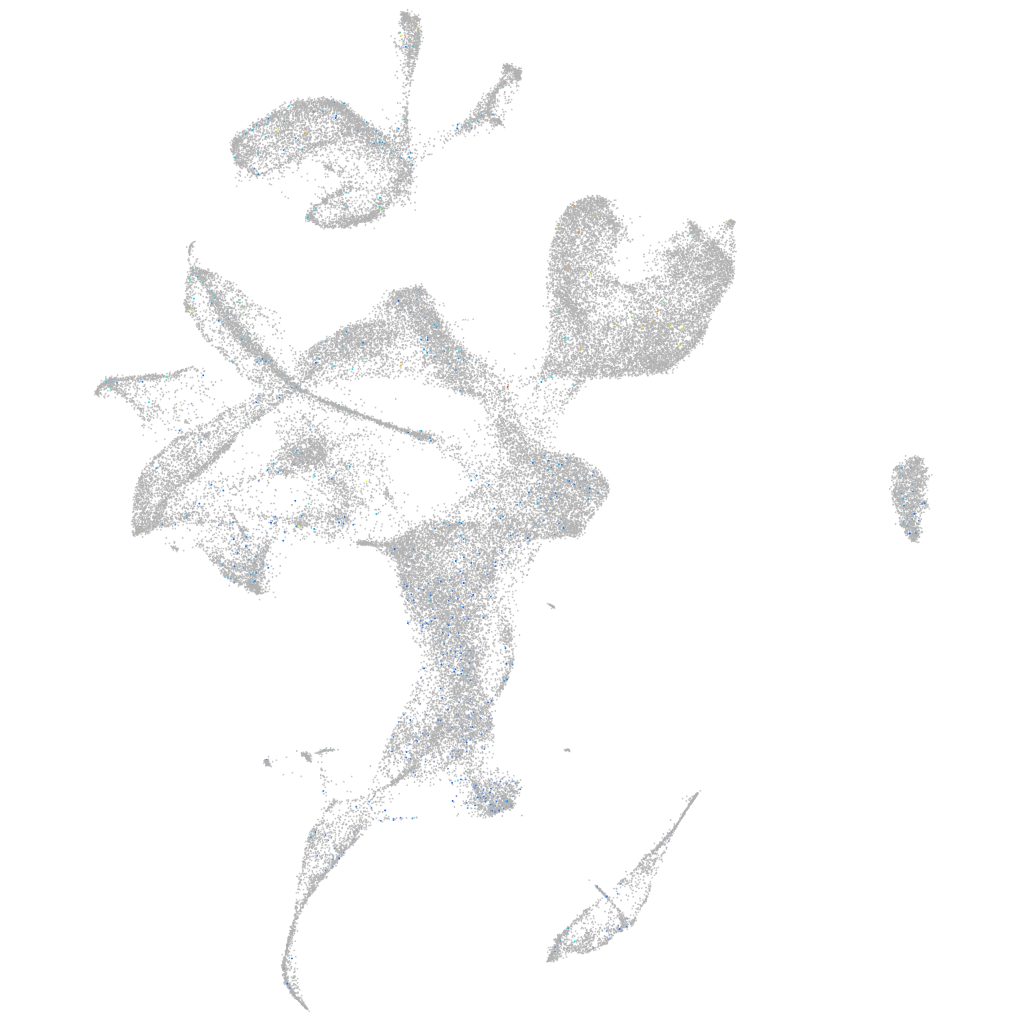
Gene expression UMAP
Display:
Expression
Stage
Other cell groups
all cells
blastomeres
PGCs
endoderm
axial mesoderm
muscle
mural cells /
non-skeletal muscle
mesenchyme
hematopoietic /
vasculature
pronephros
neural
spinal cord / glia
eye
taste / olfactory
otic / lateral line
epidermis
periderm
fin
ionocytes / mucous
pigment cells
Expression by stage/cluster
Correlated gene expression
Positive correlation
Negative correlation
Gene
r
Gene
r
LOC100149991
0.076
ckbb
-0.025
kcnj1a.2
0.067
cplx4a
-0.020
LOC103909215
0.057
crx
-0.019
pimr207
0.053
syt5b
-0.018
ahsg1
0.050
nme2a
-0.017
mir430b-10
0.049
scg3
-0.017
LOC101882235
0.048
hmgn6
-0.017
XLOC-001437
0.045
pkma
-0.017
si:ch73-29c22.1
0.044
snap25b
-0.017
LOC101886838
0.044
atp2b1b
-0.016
si:ch211-113e8.9
0.044
sypb
-0.016
CU463231.1
0.043
neurod4
-0.016
BX537143.1
0.043
actc1b
-0.015
prob1
0.042
otx5
-0.015
LOC101886920
0.042
atp1b2a
-0.015
CU565528.1
0.040
atp1a3a
-0.015
FITM1 (1 of many)
0.040
hbbe1.3
-0.015
XLOC-015433
0.040
sv2ba
-0.015
adgrg4a
0.040
CABZ01041495.1
-0.015
si:dkey-68l7.2
0.040
cnrip1b
-0.015
LOC110439436
0.040
pvalb1
-0.015
BX470188.1
0.039
prph2a
-0.015
LOC101884966
0.039
sept4a
-0.015
CR788236.1
0.038
unc13ba
-0.015
lpar5a
0.036
samsn1a
-0.014
CU138533.2
0.036
stxbp1b
-0.014
LOC794452
0.036
FP017274.1
-0.014
znf1090
0.036
nectin1a
-0.014
LOC101882606
0.036
calb2b
-0.014
nfatc2b
0.036
tmem184ba
-0.014
abo
0.035
fstl5
-0.014
wee2
0.035
si:ch211-285j22.3
-0.014
LOC101886946.1
0.035
ndrg1a
-0.014
mrvi1
0.035
tspan9a
-0.014
si:ch211-215j19.12
0.034
si:ch73-1a9.3
-0.014