Daniocell
zgc:174696 (blastomeres)
zgc:174696
ZFIN
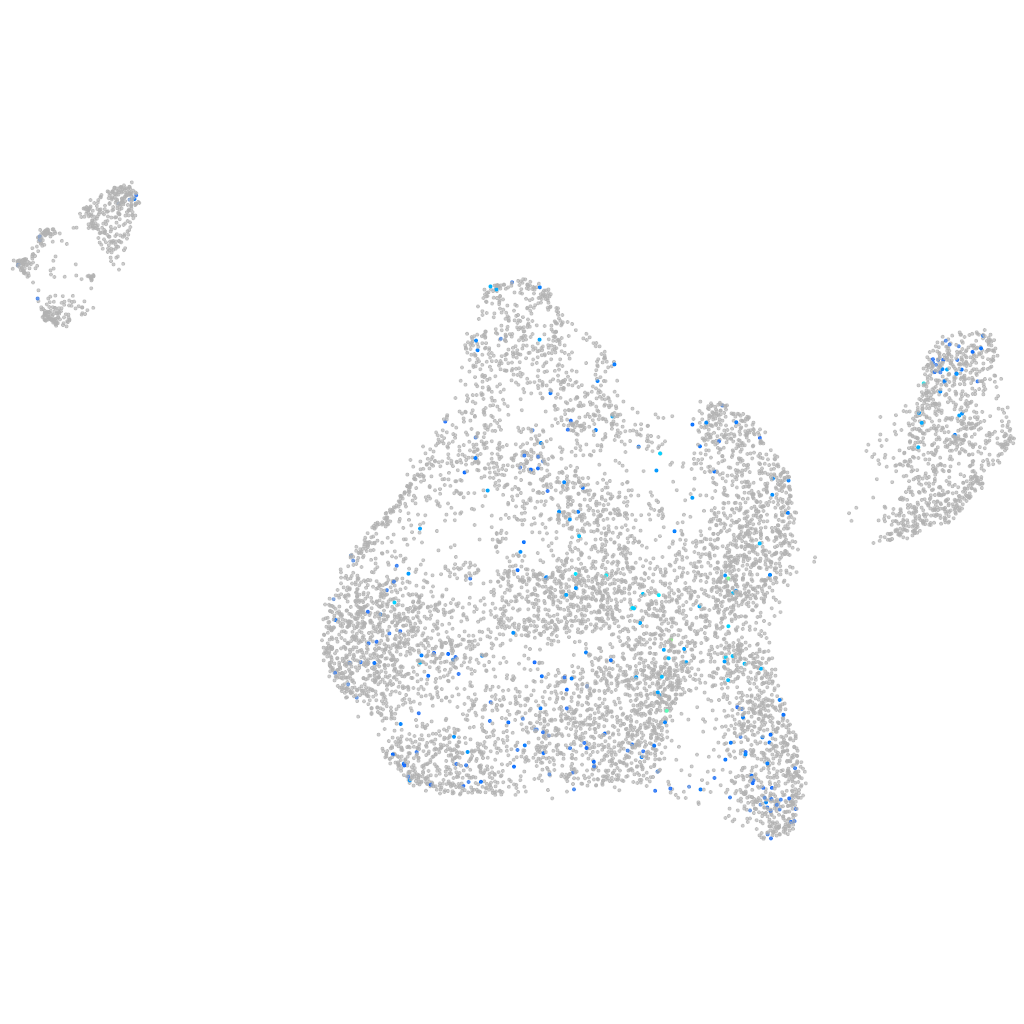
Gene expression UMAP
Display:
Expression
Stage
Other cell groups
all cells
blastomeres
PGCs
endoderm
axial mesoderm
muscle
mural cells /
non-skeletal muscle
mesenchyme
hematopoietic /
vasculature
pronephros
neural
spinal cord / glia
eye
taste / olfactory
otic / lateral line
epidermis
periderm
fin
ionocytes / mucous
pigment cells
Expression by stage/cluster
Correlated gene expression
Positive correlation
Negative correlation
Gene
r
Gene
r
LOC103909067
0.145
wu:fj13e08
-0.030
zgc:114181
0.134
pafah1b1b
-0.030
myl4
0.119
cyp11a1
-0.029
LOC100536643
0.112
si:ch1073-75o15.4
-0.029
ms4a17a.1
0.095
ctdspl3
-0.028
si:ch211-147d7.5
0.094
triobpb
-0.028
LO018598.1
0.093
gmfb
-0.027
si:ch211-195h23.4
0.087
prss16
-0.027
CR749168.2
0.086
ccnb1
-0.027
aqp1a.2
0.086
fitm2
-0.026
FP085432.1
0.085
cep57
-0.026
si:ch211-232d10.3
0.084
riox2
-0.026
LOC100006926
0.083
ngly1
-0.026
CU856343.1
0.082
orc6
-0.026
hnf1ba
0.079
fkbp8
-0.026
FP340271.1
0.078
tspan7
-0.025
LOC108181458
0.077
kank1b
-0.025
arf3a
0.077
cebpg
-0.025
muc13a
0.077
exd2
-0.025
LOC103909114
0.077
gmppb
-0.025
BX000451.1
0.076
tsc22d3
-0.025
CR848032.1
0.075
pik3r3b
-0.025
lhfpl5a
0.074
sdhaf2
-0.025
LOC103910025
0.074
ctu2
-0.024
si:dkey-17m8.2
0.074
dlg3
-0.024
paqr7b
0.073
fam113
-0.024
efna3b
0.073
mfsd8
-0.024
FP236331.1
0.072
wdfy3
-0.024
FP016019.1
0.072
ankrd37
-0.024
ncs1b
0.072
piga
-0.024
sema4gb
0.072
si:ch73-71c20.5
-0.024
zgc:162182
0.070
si:dkey-208k4.2
-0.024
nkx2.4b
0.069
LOC108183338
-0.023
slc2a1b
0.069
pgs1
-0.023
LOC101882847
0.068
ldlrap1a
-0.023