
zgc:101130
ZFIN 
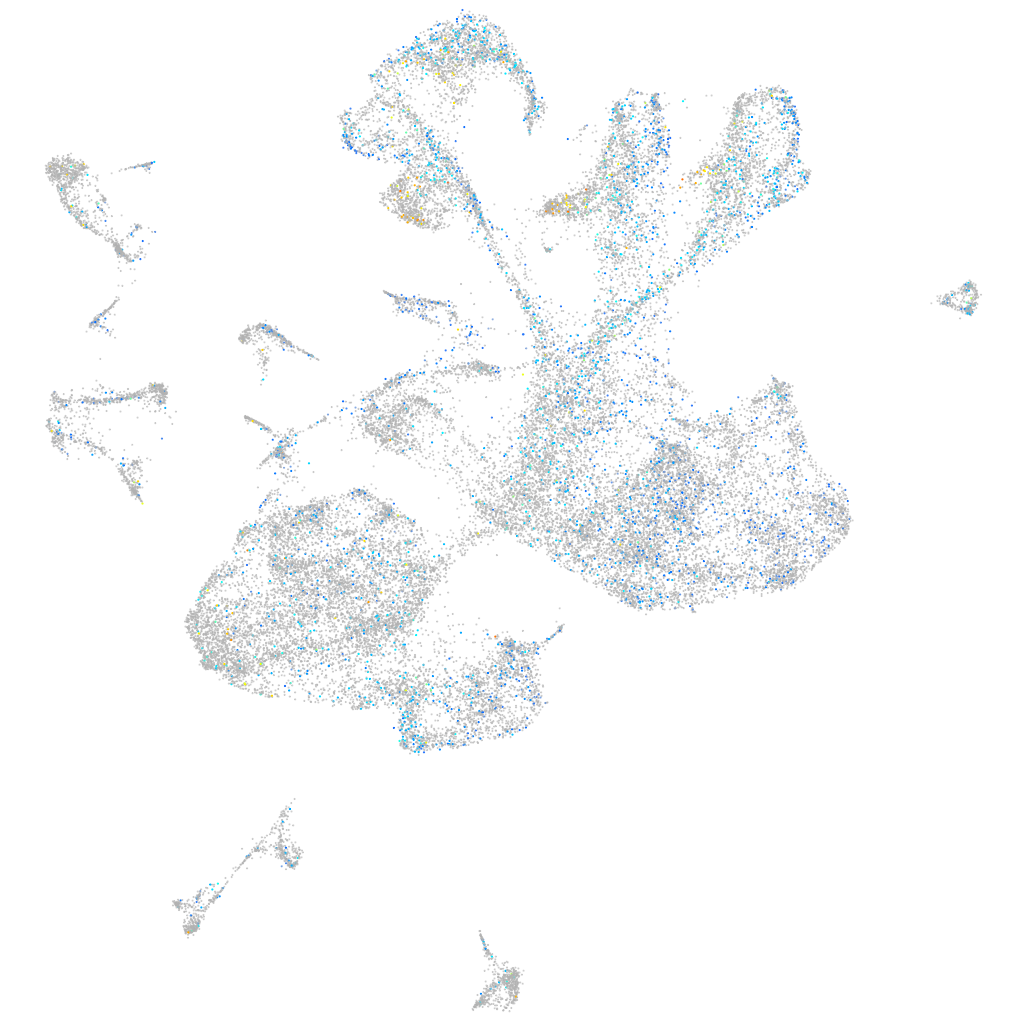
Gene expression UMAP


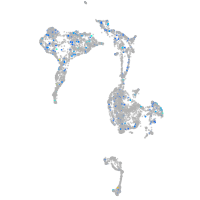


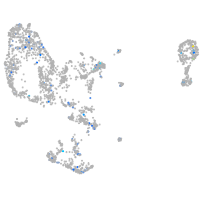


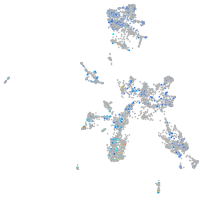


Expression by stage/cluster
Correlated gene expression
| Positive correlation | Negative correlation | ||
| Gene | r | Gene | r |
| elavl3 | 0.108 | id1 | -0.064 |
| myt1b | 0.097 | fabp7a | -0.061 |
| rtn1a | 0.095 | atp1a1b | -0.060 |
| tmeff1b | 0.093 | mdka | -0.057 |
| hmgb3a | 0.091 | XLOC-003690 | -0.050 |
| zc4h2 | 0.091 | qki2 | -0.049 |
| gng2 | 0.090 | cd63 | -0.047 |
| ywhah | 0.090 | sparc | -0.047 |
| sncb | 0.088 | cd82a | -0.046 |
| stxbp1a | 0.088 | sdc4 | -0.044 |
| stmn1b | 0.087 | msna | -0.044 |
| gng3 | 0.086 | atp1b4 | -0.044 |
| nova2 | 0.085 | cldn5a | -0.042 |
| onecut1 | 0.084 | vamp3 | -0.042 |
| si:dkey-276j7.1 | 0.083 | si:ch211-286b5.5 | -0.042 |
| tubb5 | 0.083 | endouc | -0.042 |
| nsg2 | 0.082 | snu13b | -0.041 |
| tmsb | 0.082 | eef1da | -0.041 |
| ywhag2 | 0.081 | pgrmc1 | -0.041 |
| tmem59l | 0.081 | zgc:165461 | -0.041 |
| atcaya | 0.081 | npc2 | -0.040 |
| id4 | 0.079 | her9 | -0.040 |
| jagn1a | 0.079 | psat1 | -0.040 |
| vamp2 | 0.079 | COX7A2 (1 of many) | -0.040 |
| nova1 | 0.079 | GCA | -0.040 |
| stx1b | 0.078 | si:ch73-265d7.2 | -0.039 |
| rtn1b | 0.078 | sox2 | -0.039 |
| myt1a | 0.077 | pa2g4b | -0.039 |
| stmn2a | 0.076 | si:ch211-251b21.1 | -0.039 |
| h3f3d | 0.076 | efhd1 | -0.038 |
| atp6v0cb | 0.075 | ptn | -0.038 |
| cplx2 | 0.075 | npm1a | -0.038 |
| tuba1c | 0.075 | atp1b1a | -0.038 |
| snap25a | 0.075 | nhp2 | -0.038 |
| syt2a | 0.074 | ccng1 | -0.037 |