
vimentin
ZFIN 
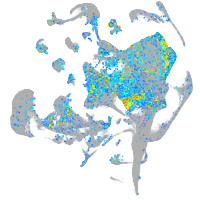
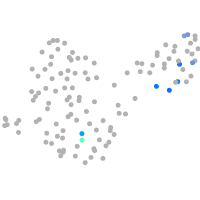
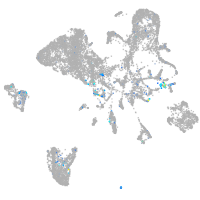
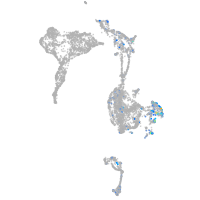
Gene expression UMAP


Expression by stage/cluster
Correlated gene expression
| Positive correlation | Negative correlation | ||
| Gene | r | Gene | r |
| tuba8l3 | 0.362 | ncl | -0.120 |
| onecut1 | 0.292 | dkc1 | -0.114 |
| isl2b | 0.289 | nop58 | -0.111 |
| nes | 0.261 | lig1 | -0.109 |
| ngfrb | 0.239 | fbl | -0.109 |
| onecutl | 0.238 | nop2 | -0.104 |
| mmp25b | 0.216 | banf1 | -0.103 |
| tlx2 | 0.214 | hspb1 | -0.103 |
| nhlh2 | 0.211 | nop56 | -0.102 |
| six1b | 0.208 | nasp | -0.101 |
| isl2a | 0.204 | si:ch73-281n10.2 | -0.100 |
| ebf2 | 0.202 | anp32b | -0.098 |
| si:ch211-57n23.4 | 0.200 | ddx18 | -0.098 |
| ppp1r1c | 0.199 | aldob | -0.098 |
| dlb | 0.198 | gar1 | -0.098 |
| prph | 0.191 | pcna | -0.097 |
| onecut2 | 0.191 | ccnd1 | -0.095 |
| pcbp4 | 0.190 | gnl3 | -0.094 |
| tubb2 | 0.188 | zmp:0000000624 | -0.093 |
| si:ch211-215d8.2 | 0.187 | si:ch211-152c2.3 | -0.093 |
| anxa13l | 0.186 | nucks1b | -0.092 |
| cbfb | 0.183 | npm1a | -0.092 |
| si:ch211-56a11.2 | 0.182 | stm | -0.092 |
| elavl3 | 0.181 | hirip3 | -0.091 |
| tagln3b | 0.180 | chaf1a | -0.090 |
| hoxc1a | 0.176 | pprc1 | -0.090 |
| ntrk1 | 0.176 | apoeb | -0.089 |
| si:ch1073-284b18.2 | 0.174 | lyar | -0.089 |
| six1a | 0.174 | mphosph10 | -0.089 |
| lin28a | 0.173 | rsl1d1 | -0.089 |
| insm1b | 0.173 | mybbp1a | -0.088 |
| tspan2b | 0.163 | snu13b | -0.087 |
| crabp1b | 0.162 | mki67 | -0.087 |
| six2b | 0.162 | apoc1 | -0.087 |
| gsna | 0.161 | mcm6 | -0.087 |