Daniocell
tyw3 (pigment cells)
tRNA-yW synthesizing protein 3 homolog (S. cerevisiae)
ZFIN
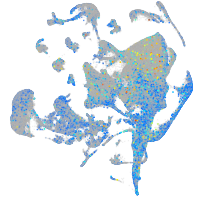
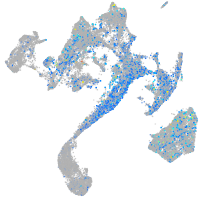
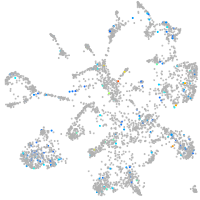
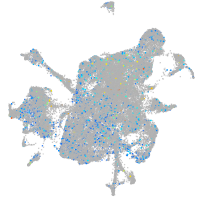
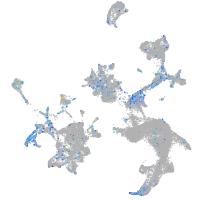
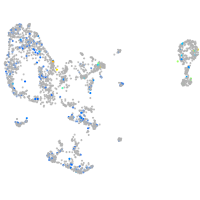
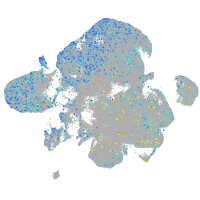
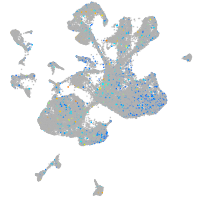
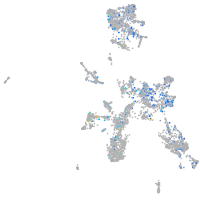
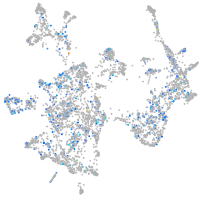
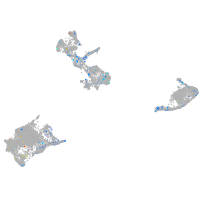
Gene expression UMAP
Display:
Expression
Stage
Other cell groups
all cells
blastomeres
PGCs
endoderm
axial mesoderm
muscle
mural cells /
non-skeletal muscle
mesenchyme
hematopoietic /
vasculature
pronephros
neural
spinal cord / glia
eye
taste / olfactory
otic / lateral line
epidermis
periderm
fin
ionocytes / mucous
pigment cells
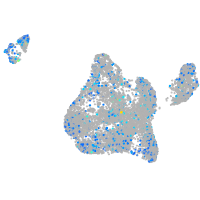
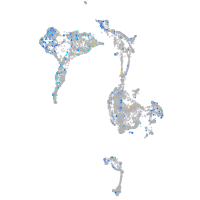
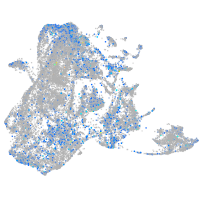
Expression by stage/cluster
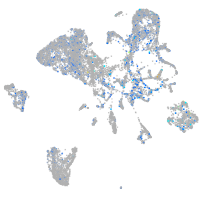
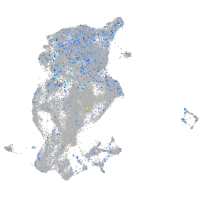
Correlated gene expression
Positive correlation
Negative correlation
Gene
r
Gene
r
BX571724.1
0.165
gstp1
-0.073
LOC101887000
0.148
gch2
-0.063
mfng
0.140
uraha
-0.054
BX901922.1
0.137
slc22a7a
-0.050
XLOC-029463
0.129
si:dkey-251i10.2
-0.050
BX649481.1
0.119
prdx1
-0.047
casc1
0.117
CABZ01021592.1
-0.046
chtopb
0.112
akr1b1
-0.044
opn6b
0.111
zgc:110339
-0.041
BX890559.2
0.111
pts
-0.040
zmp:0000000991
0.110
cotl1
-0.039
snu13b
0.107
hbae1.1
-0.039
CR450686.1
0.105
rbp4l
-0.039
LOC101886318
0.105
gpd1b
-0.038
si:ch211-251f6.7
0.104
prdx6
-0.037
XLOC-013086
0.101
oacyl
-0.036
BX537120.3
0.100
cyb561a3b
-0.036
tmem121ab
0.099
slc2a15a
-0.035
si:ch73-7i4.1
0.099
actc1b
-0.035
si:ch1073-391i24.1
0.098
hbbe1.3
-0.035
tagln3a
0.098
txn
-0.035
tspan11
0.098
prdx5
-0.032
exorh
0.097
cyb5a
-0.032
si:ch73-361h17.1
0.096
mdh1aa
-0.032
XLOC-032570
0.095
tnni2a.4
-0.031
fbl
0.094
hbbe1.2
-0.031
XLOC-026920
0.093
COX3
-0.030
nts
0.093
gapdh
-0.030
hnrnpabb
0.092
anxa13l
-0.029
caspa
0.092
tmem130
-0.029
unc119.2
0.090
LO017835.1
-0.029
adipor2
0.090
CABZ01032488.1
-0.028
shq1
0.089
sult1st1
-0.028
si:dkey-23i12.5
0.089
krt4
-0.027
aamp
0.088
hbae3
-0.027