Daniocell
tut4 (all cells)
terminal uridylyl transferase 4
ZFIN
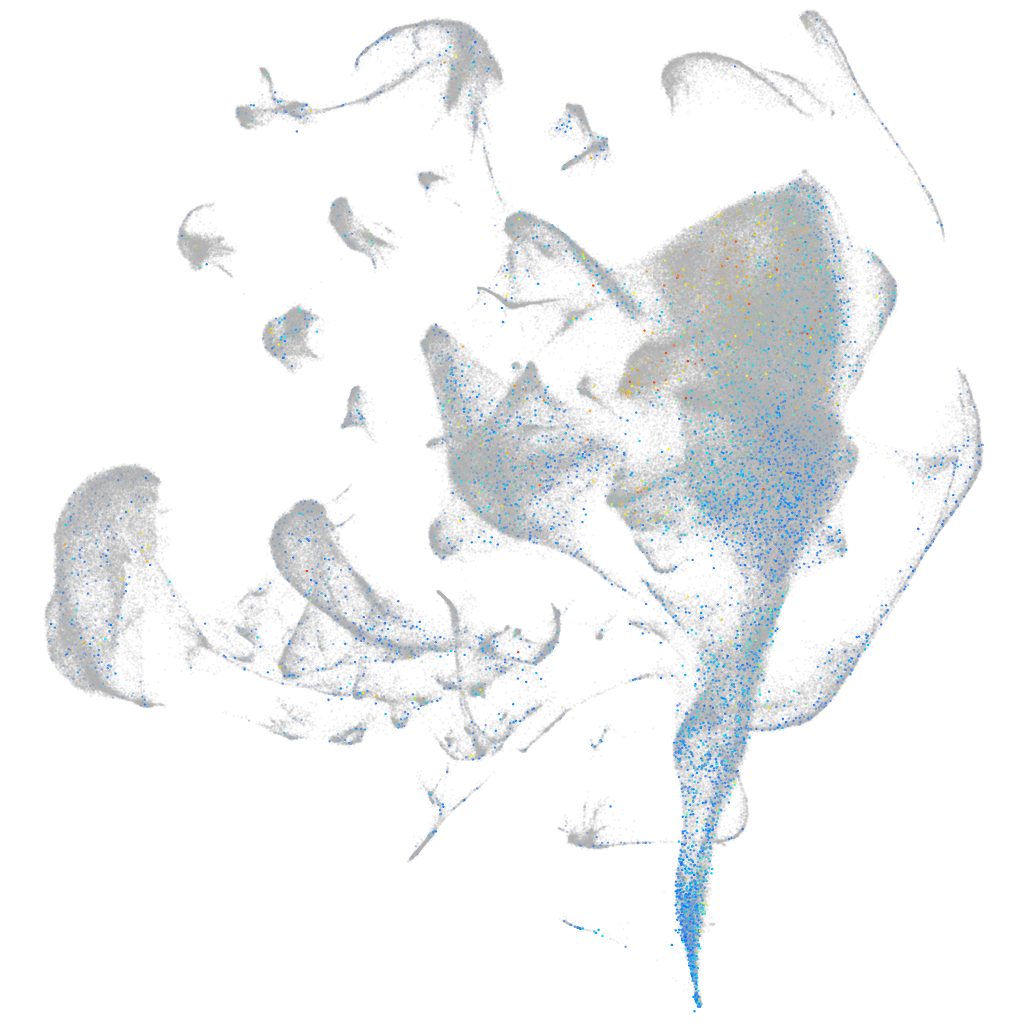
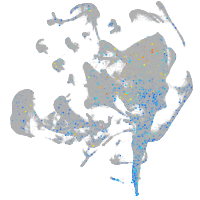
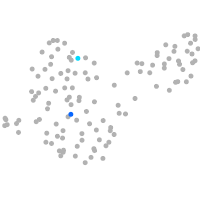
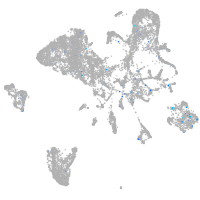
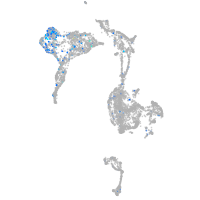
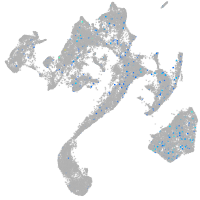
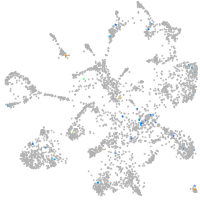
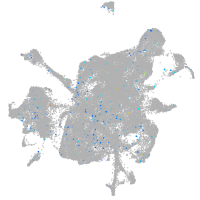
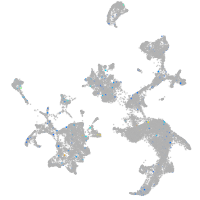
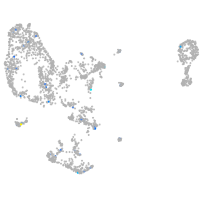
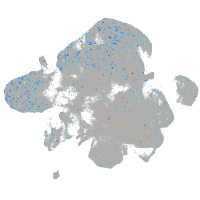
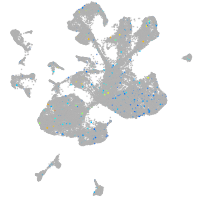
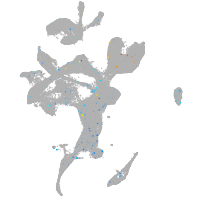
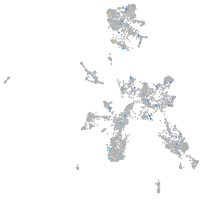
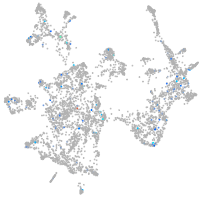
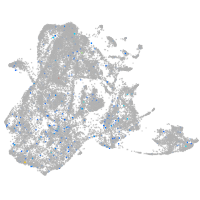
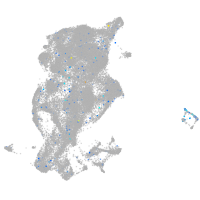
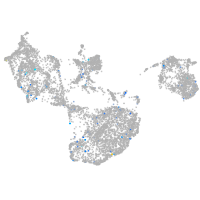
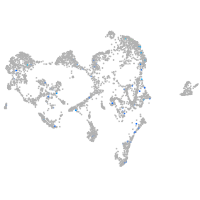
Gene expression UMAP
Display:
Expression
Stage
Other cell groups
all cells
blastomeres
PGCs
endoderm
axial mesoderm
muscle
mural cells /
non-skeletal muscle
mesenchyme
hematopoietic /
vasculature
pronephros
neural
spinal cord / glia
eye
taste / olfactory
otic / lateral line
epidermis
periderm
fin
ionocytes / mucous
pigment cells
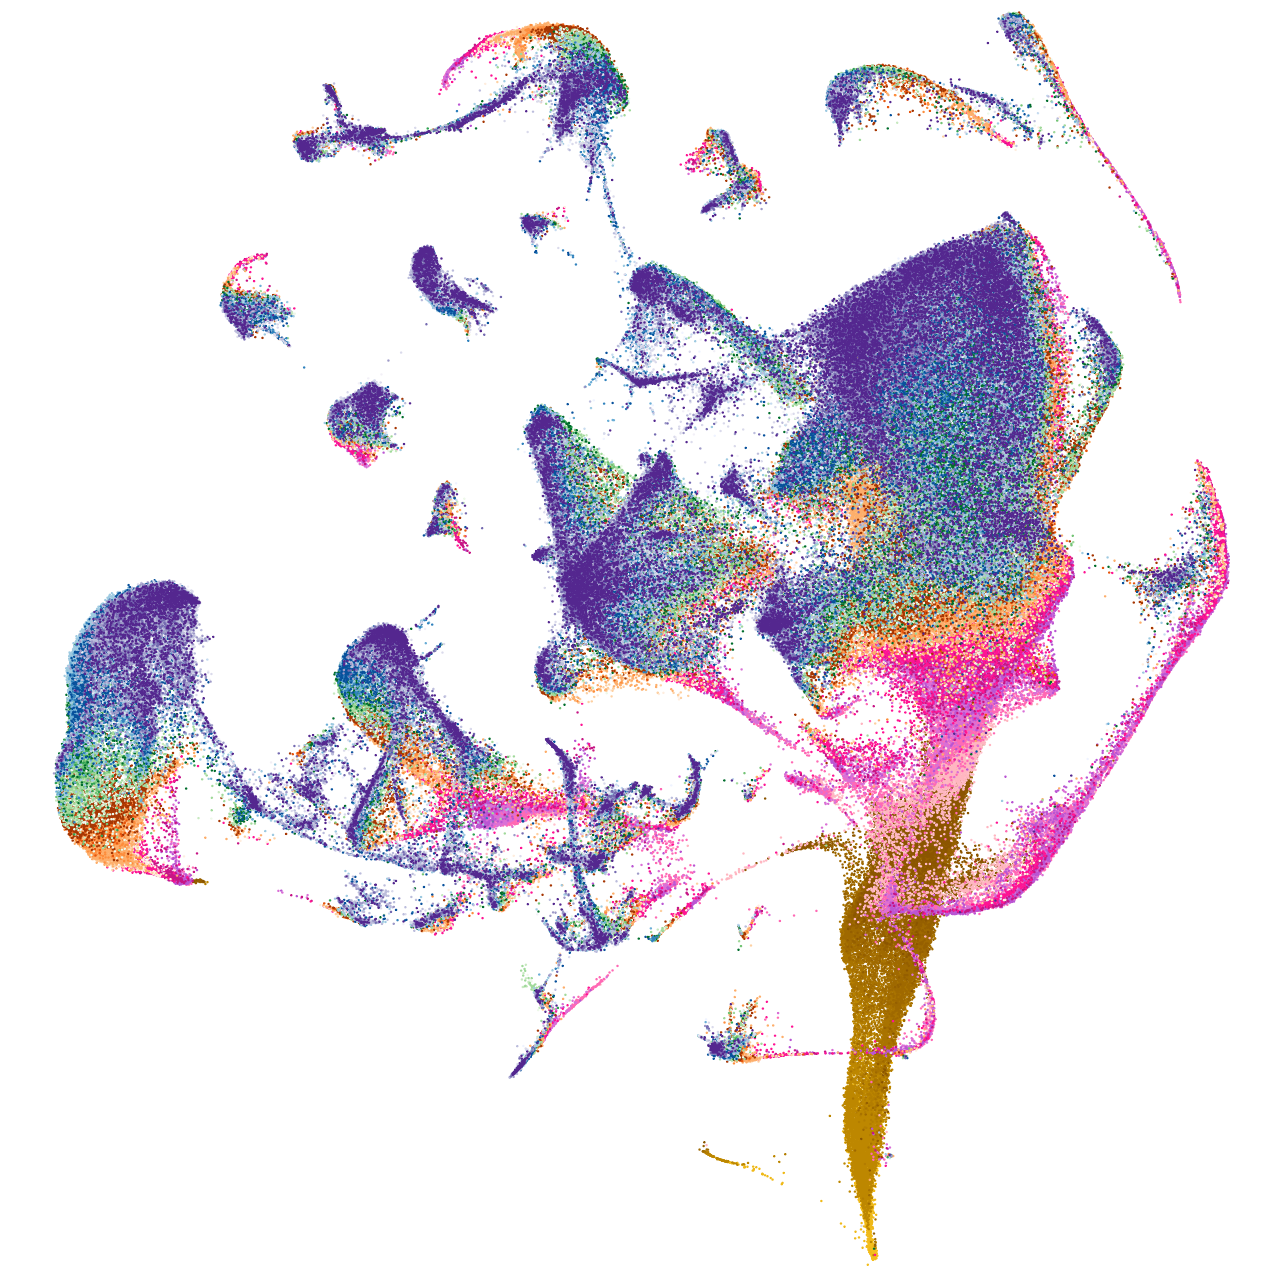
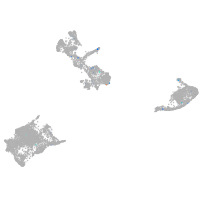
Expression by stage/cluster
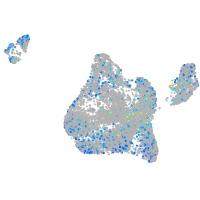
Correlated gene expression
Positive correlation
Negative correlation
Gene
r
Gene
r
h1m
0.092
cyt1
-0.040
nanog
0.088
krt4
-0.039
nnr
0.087
cyt1l
-0.036
pou5f3
0.085
icn
-0.035
ccna1
0.083
anxa1a
-0.034
si:dkeyp-114g9.1
0.083
pvalb1
-0.034
asb11
0.081
pvalb2
-0.034
si:ch1073-80i24.3
0.081
icn2
-0.033
si:dkey-68o6.5
0.081
krt5
-0.033
cldnd
0.079
krtt1c19e
-0.032
zgc:56699
0.078
s100a10b
-0.032
zgc:173742
0.077
si:ch211-195b11.3
-0.032
avd
0.076
tmsb1
-0.032
zgc:77118
0.076
actc1b
-0.031
si:dkey-228b2.6
0.075
krt17
-0.031
s100a1
0.074
pycard
-0.030
acp5a
0.073
zgc:153284
-0.030
si:ch211-173m16.2
0.072
anxa1c
-0.029
zgc:100951
0.072
hbbe1.3
-0.029
ccne1
0.069
wu:fb18f06
-0.029
hnrnpa1b
0.069
aep1
-0.028
lrwd1
0.069
agr1
-0.028
ddx4
0.068
anxa2a
-0.028
rbm4.3
0.068
hbae1.1
-0.028
tbx16
0.068
hbae3
-0.028
hnrnpub
0.067
mgst1.2
-0.028
map1lc3c
0.067
zgc:193505
-0.028
polr3gla
0.067
pnp5a
-0.027
ppm1g
0.067
si:ch211-105c13.3
-0.027
si:ch73-303b9.1
0.067
tob1b
-0.027
BX005461.1
0.066
zgc:162730
-0.027
h2af1al
0.066
atp5if1b
-0.026
LOC101885477
0.066
hbbe1.1
-0.026
LOC101885485
0.065
s100v1
-0.026
mcm6l
0.065
si:dkey-222n6.2
-0.026