Daniocell
tsn (pigment cells)
translin
ZFIN
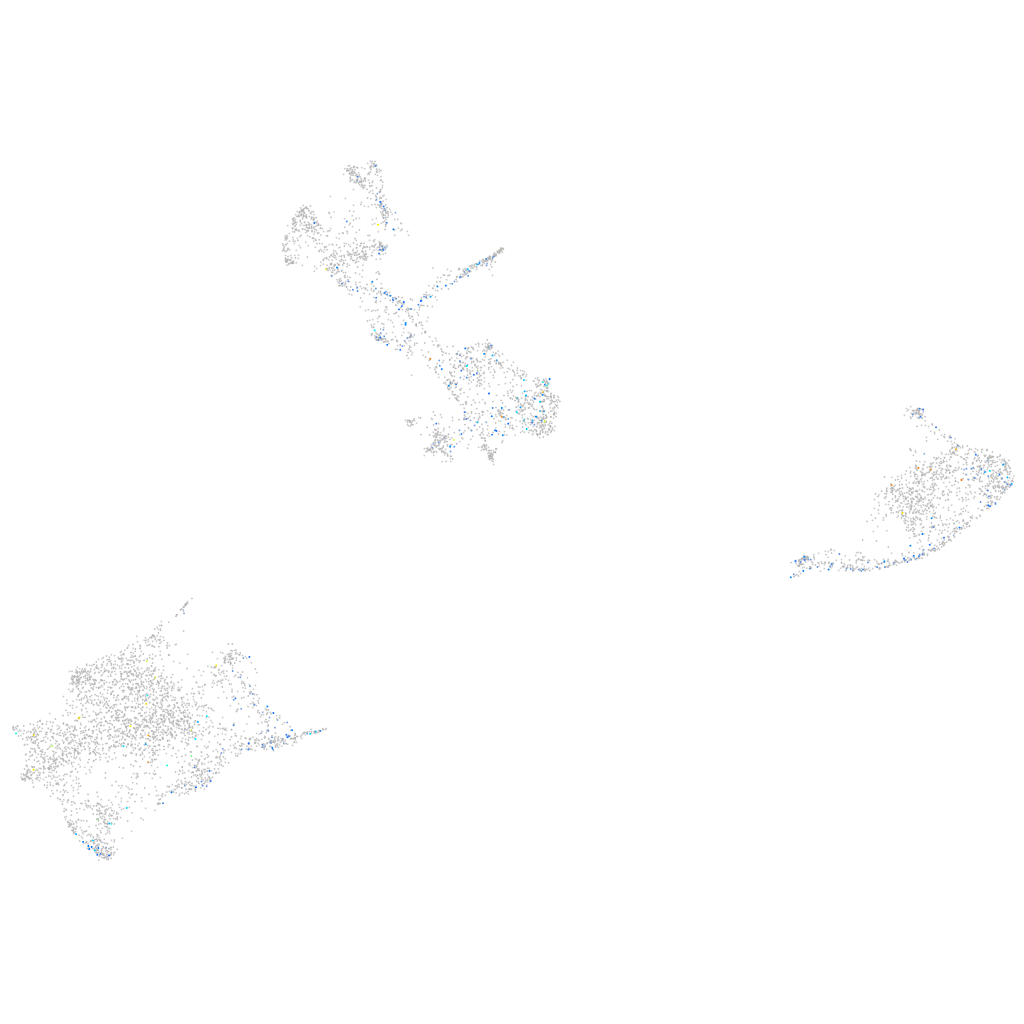
Gene expression UMAP
Display:
Expression
Stage
Other cell groups
all cells
blastomeres
PGCs
endoderm
axial mesoderm
muscle
mural cells /
non-skeletal muscle
mesenchyme
hematopoietic /
vasculature
pronephros
neural
spinal cord / glia
eye
taste / olfactory
otic / lateral line
epidermis
periderm
fin
ionocytes / mucous
pigment cells
Expression by stage/cluster
Correlated gene expression
Positive correlation
Negative correlation
Gene
r
Gene
r
cbln10
0.168
si:dkey-251i10.2
-0.058
cpeb1b
0.168
uraha
-0.057
zgc:158412
0.160
CABZ01021592.1
-0.053
kiaa1549lb
0.157
slc22a7a
-0.052
LOC101884173
0.142
zgc:110339
-0.050
XLOC-043400
0.140
gch2
-0.049
xpnpep2
0.140
gstp1
-0.048
mir181b-1
0.137
zgc:153031
-0.044
si:ch211-248l17.3
0.131
rbp4l
-0.043
kcna4
0.122
nupr1a
-0.040
si:ch211-112g6.4
0.118
oacyl
-0.039
LOC108190717
0.116
krt4
-0.038
si:ch1073-181h11.2
0.116
gpd1b
-0.038
rab11fip3
0.114
mdh1aa
-0.038
LOC108190763
0.111
myhz1.1
-0.037
si:ch211-214p13.8
0.111
ahnak
-0.037
XLOC-020666
0.110
tmem130
-0.036
c1qtnf1
0.109
pvalb1
-0.035
slc7a7
0.108
actc1b
-0.034
XLOC-017229
0.107
si:ch211-251b21.1
-0.034
NC-002333.19
0.106
pts
-0.033
si:ch211-234p6.5
0.105
icn2
-0.033
si:dkeyp-82h4.1
0.105
prdx5
-0.032
XLOC-013854
0.104
myhz1.2
-0.032
il12rb2
0.102
nme2b.2
-0.032
BX248418.2
0.102
prdx1
-0.031
si:ch1073-335m2.2
0.101
TMEM19
-0.031
AL772241.2
0.098
oxr1b
-0.031
LOC100330441
0.098
slc2a15a
-0.030
znf1095
0.098
akr1b1
-0.030
si:ch211-51e12.7
0.098
XLOC-019062
-0.029
khdrbs1a
0.098
LOC110439372
-0.028
zgc:174573
0.098
si:ch211-71m22.3
-0.028
tdrd6
0.097
LOC100534832
-0.028
h2afva
0.097
pvalb2
-0.028