Daniocell
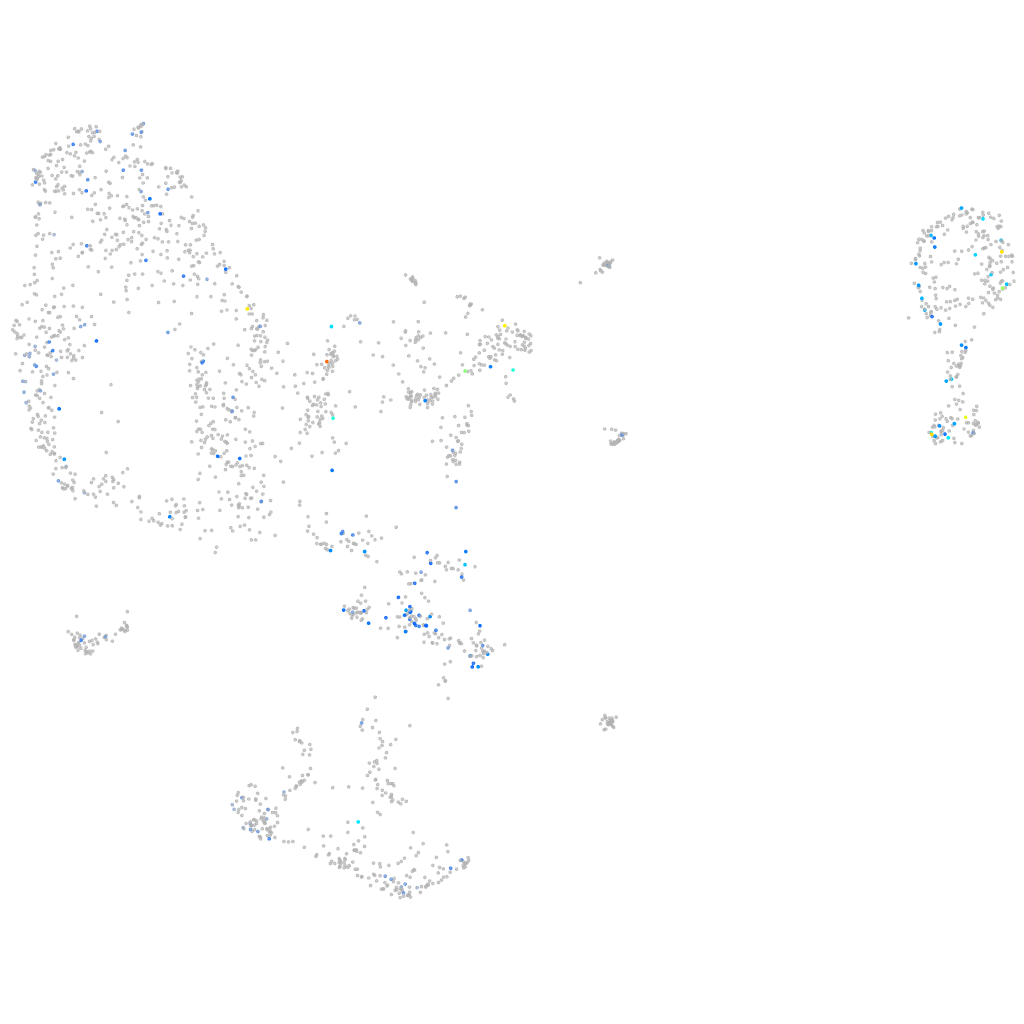
tsn (pronephros)
translin
ZFIN
Gene expression UMAP
Display:
Expression
Stage
Other cell groups
all cells
blastomeres
PGCs
endoderm
axial mesoderm
muscle
mural cells /
non-skeletal muscle
mesenchyme
hematopoietic /
vasculature
pronephros
neural
spinal cord / glia
eye
taste / olfactory
otic / lateral line
epidermis
periderm
fin
ionocytes / mucous
pigment cells
Expression by stage/cluster
Correlated gene expression
Positive correlation
Negative correlation
Gene
r
Gene
r
si:dkey-33c12.12
0.282
vdac3
-0.130
dlx6a
0.241
atp5mc1
-0.128
si:dkey-247m21.3
0.202
si:ch211-139a5.9
-0.123
MGAT5B
0.192
aldh6a1
-0.122
si:dkeyp-51b7.3
0.191
COX3
-0.121
aadat
0.188
eno3
-0.119
col8a1b
0.185
suclg1
-0.117
si:ch211-235f1.3
0.184
rpl37
-0.116
LO018303.1
0.184
ndufa4l
-0.116
cpsf6
0.182
ldhba
-0.116
rfx6
0.181
romo1
-0.114
tas2r202
0.177
cox6b1
-0.113
CU459012.1
0.177
eef1da
-0.112
CR352220.1
0.172
gstr
-0.111
fam98a
0.171
atp6v1e1b
-0.111
XLOC-044313
0.169
atp1b1a
-0.111
si:ch211-226l4.6
0.168
atp5l
-0.110
gnl3l
0.164
uqcrq
-0.106
si:dkeyp-82a1.2
0.163
sod1
-0.106
khdrbs1a
0.162
tnfaip8l3
-0.106
abcf1
0.162
mt-co1
-0.105
srsf2a
0.161
cox5ab
-0.105
vbp1
0.161
mt-atp6
-0.104
setb
0.161
atp5mc3b
-0.103
hnrnpaba
0.160
zgc:158463
-0.103
wu:fb97g03
0.160
pttg1ipb
-0.103
jac3
0.160
sgk2a
-0.102
si:ch73-281n10.2
0.157
sypl2a
-0.102
FP102192.1
0.156
rps10
-0.102
LOC110438082
0.155
pdzk1
-0.102
LOC110438077
0.155
elovl1b
-0.101
si:ch211-210b2.4
0.155
cdaa
-0.101
zmp:0000001069
0.155
zgc:114188
-0.100
lmo2
0.155
NC-002333.17
-0.100
pdap1a
0.154
pklr
-0.100