Daniocell
tsn (fin)
translin
ZFIN
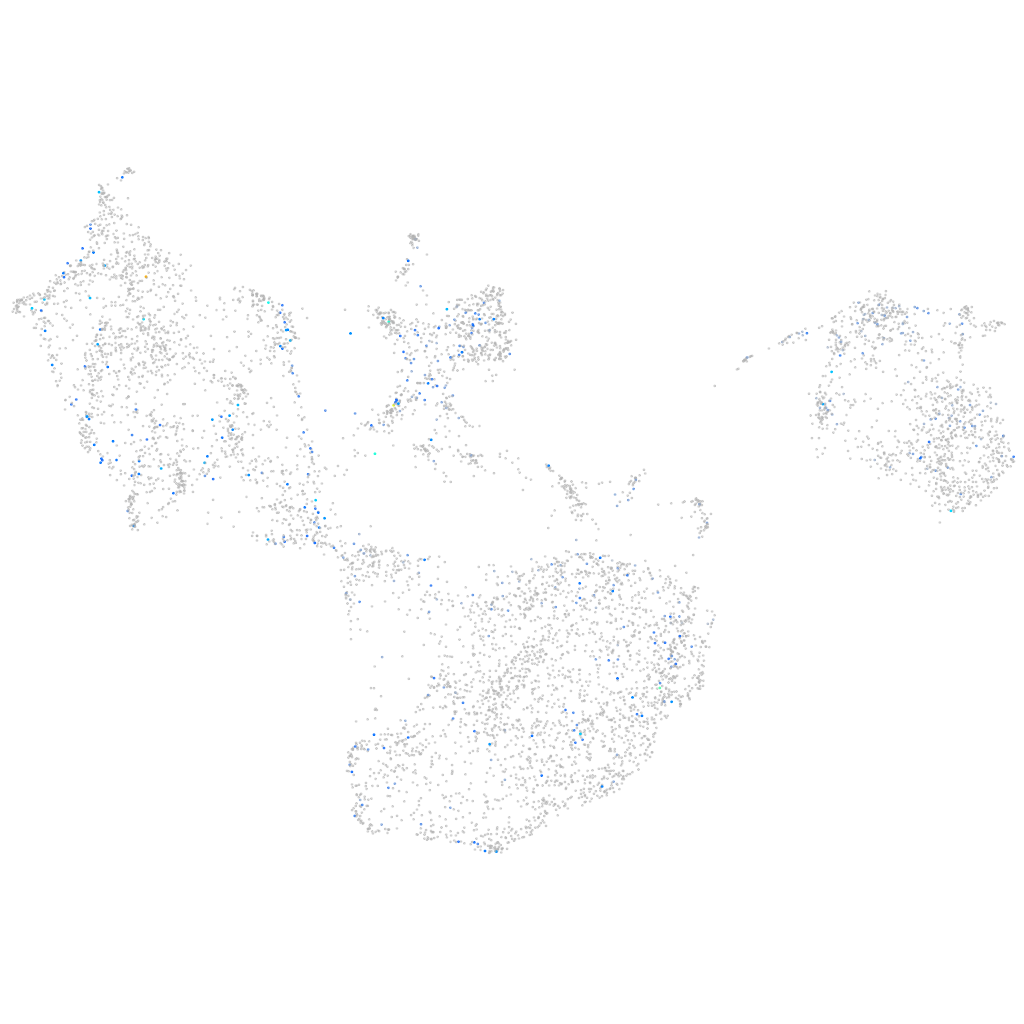
Gene expression UMAP
Display:
Expression
Stage
Other cell groups
all cells
blastomeres
PGCs
endoderm
axial mesoderm
muscle
mural cells /
non-skeletal muscle
mesenchyme
hematopoietic /
vasculature
pronephros
neural
spinal cord / glia
eye
taste / olfactory
otic / lateral line
epidermis
periderm
fin
ionocytes / mucous
pigment cells
Expression by stage/cluster
Correlated gene expression
Positive correlation
Negative correlation
Gene
r
Gene
r
LOC108182911
0.147
and1
-0.074
LOC110437711
0.134
si:dkey-248g15.3
-0.065
LOC103909712
0.134
col1a1a
-0.061
XLOC-035103
0.131
and3
-0.060
si:dkey-266m15.7
0.130
icn
-0.057
si:ch73-343g19.4
0.130
and2
-0.054
si:dkey-69c1.1
0.129
tmsb1
-0.053
si:dkeyp-34f6.4
0.120
tmsb4x
-0.053
trim35-33
0.120
frem2a
-0.050
BX957328.1
0.120
krt97
-0.049
si:ch73-22o18.1
0.119
s100a10b
-0.048
ccdc88aa
0.117
cfl1l
-0.047
LOC103911920
0.111
egfl6
-0.047
INSM2
0.110
sparc
-0.046
stx1a
0.110
aqp3a
-0.046
cct3
0.107
si:ch211-243g18.2
-0.045
tpo
0.106
cldni
-0.045
LOC110439506
0.105
thy1
-0.043
si:dkey-238o14.1
0.105
anxa1a
-0.043
khdrbs1a
0.103
ak1
-0.042
LOC103910526
0.101
si:dkey-178e17.3
-0.042
sumo3a
0.099
rbp4
-0.042
LOC100537369
0.098
cldn1
-0.041
hnrnpa0b
0.097
zgc:92380
-0.041
XLOC-032541
0.097
im:7150988
-0.041
sumo2b
0.096
bcam
-0.041
hnrnpabb
0.096
cast
-0.040
XLOC-011190
0.095
tmem59
-0.040
snrpe
0.095
epcam
-0.040
hmgn2
0.095
ecrg4b
-0.040
skp1
0.094
pfn1
-0.039
setb
0.094
cyt1
-0.039
eif4a1a
0.094
si:ch1073-406l10.2
-0.038
snrpd3l
0.094
arhgef5
-0.038
psma3
0.093
col18a1a
-0.038