Daniocell
tjp2a (mural cells / non-skeletal muscle)
tight junction protein 2a (zona occludens 2)
ZFIN
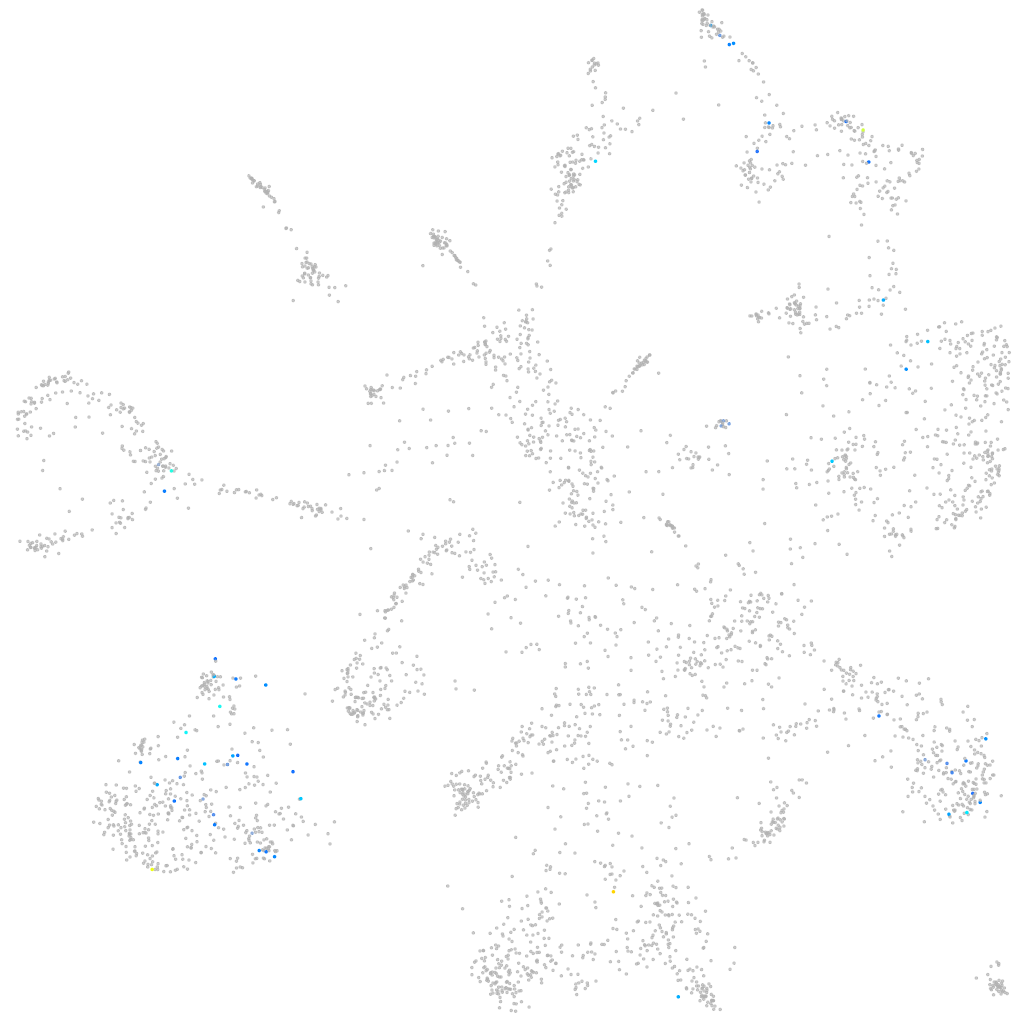
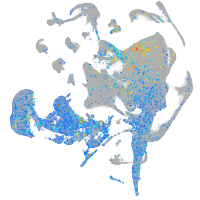
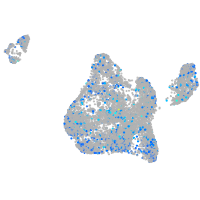
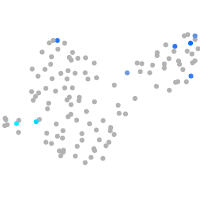
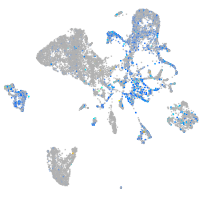
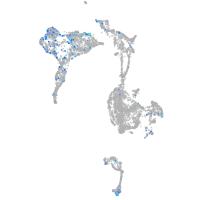
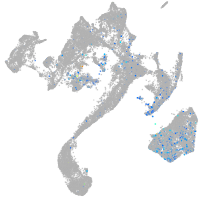
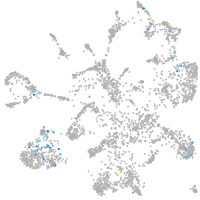
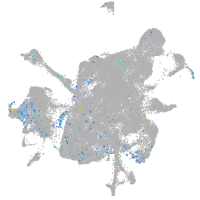
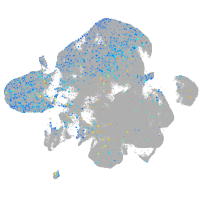
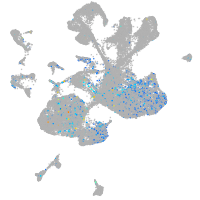
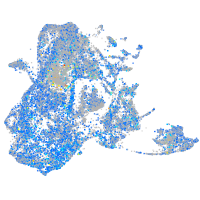
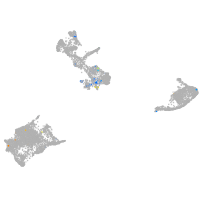
Gene expression UMAP
Display:
Expression
Stage
Other cell groups
all cells
blastomeres
PGCs
endoderm
axial mesoderm
muscle
mural cells /
non-skeletal muscle
mesenchyme
hematopoietic /
vasculature
pronephros
neural
spinal cord / glia
eye
taste / olfactory
otic / lateral line
epidermis
periderm
fin
ionocytes / mucous
pigment cells
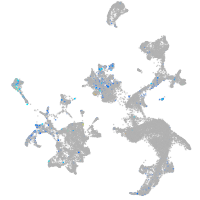
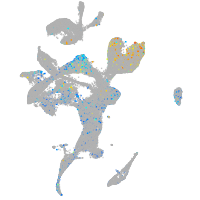
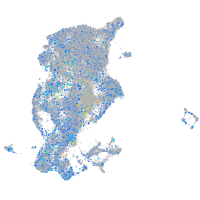
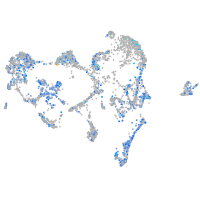
Expression by stage/cluster
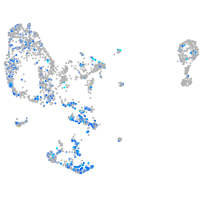
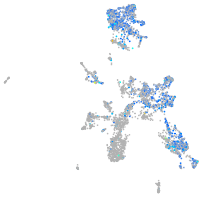
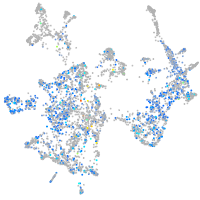
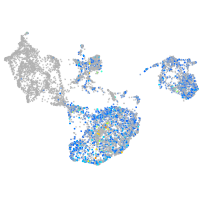
Correlated gene expression
Positive correlation
Negative correlation
Gene
r
Gene
r
ryr2a
0.258
id3
-0.042
LOC103908683.1
0.245
foxf1
-0.042
FO704821.1
0.222
tmem176l.1
-0.041
foxb1b
0.220
zgc:158343
-0.040
RF01234
0.215
smad7
-0.039
si:ch73-216m24.3
0.210
si:dkey-7j14.6
-0.039
her11
0.192
her6
-0.038
ppil6
0.188
fstl1b
-0.038
si:ch211-271d10.2
0.178
mcl1a
-0.038
pdzph1
0.177
fosab
-0.037
CABZ01070852.1
0.175
serpine1
-0.037
sp5l
0.175
ilk
-0.037
zmp:0000000652
0.172
BX088707.3
-0.036
cd8a
0.172
tnni2a.4
-0.035
CABZ01004876.1
0.172
col1a2
-0.035
BX547934.2
0.171
ier2b
-0.035
mmp25a
0.169
zgc:162730
-0.035
ehd2a
0.164
actc1b
-0.035
AL935303.1
0.164
si:ch211-51c14.1
-0.035
pex6
0.160
ckma
-0.035
uts1
0.160
si:dkey-238c7.16
-0.034
cacna1fa
0.157
pvalb2
-0.034
si:ch211-160b11.4
0.152
pmp22a
-0.034
si:dkey-30f3.2
0.151
sdc4
-0.034
si:ch211-105f12.2
0.148
higd1a
-0.034
gsx2
0.147
socs3a
-0.033
XLOC-004668
0.147
prss59.2
-0.033
syt5b
0.144
lamb1b
-0.033
trim46b
0.144
boka
-0.032
znf1039
0.141
il6st
-0.032
zgc:153441
0.138
si:ch73-238c9.1
-0.032
MAP3K13
0.136
si:ch211-15b10.6
-0.031
rcvrna
0.136
agtr2
-0.031
si:dkeyp-79b7.3
0.136
meis1a
-0.031
LOC100334487
0.136
gadd45bb
-0.031