Daniocell
tfap2d (otic / lateral line)
transcription factor AP-2 delta (activating enhancer binding protein 2 delta)
ZFIN
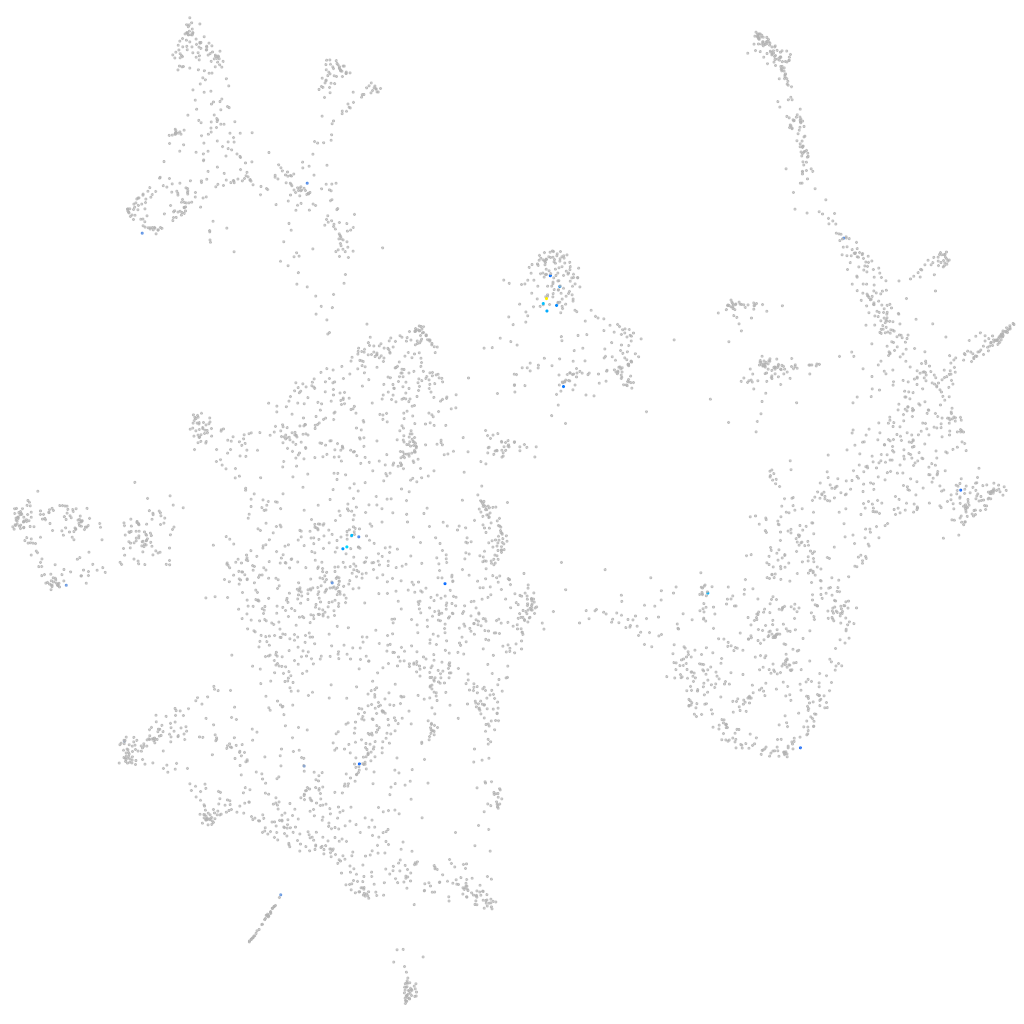
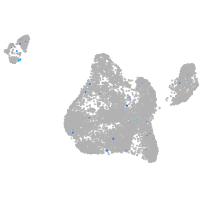
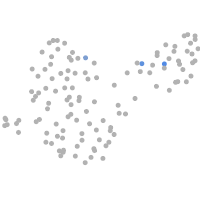
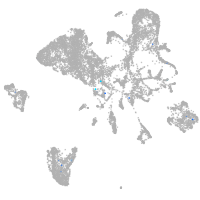
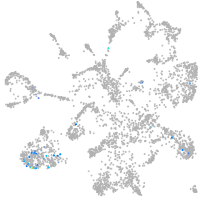
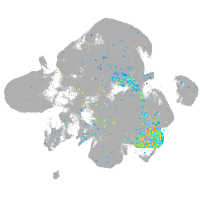
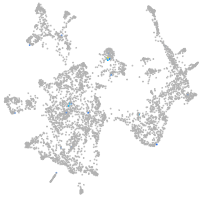
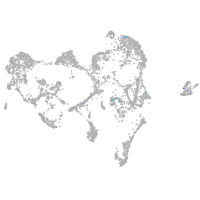
Gene expression UMAP
Display:
Expression
Stage
Other cell groups
all cells
blastomeres
PGCs
endoderm
axial mesoderm
muscle
mural cells /
non-skeletal muscle
mesenchyme
hematopoietic /
vasculature
pronephros
neural
spinal cord / glia
eye
taste / olfactory
otic / lateral line
epidermis
periderm
fin
ionocytes / mucous
pigment cells
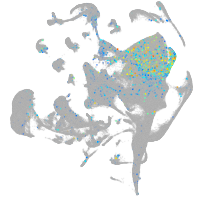
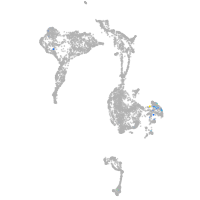
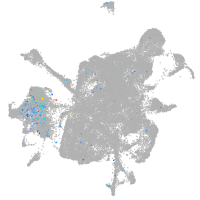
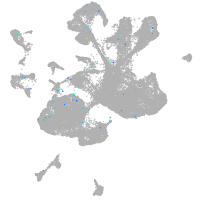
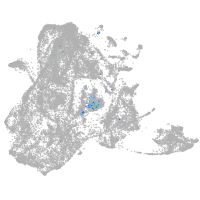
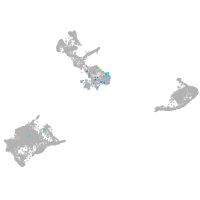
Expression by stage/cluster
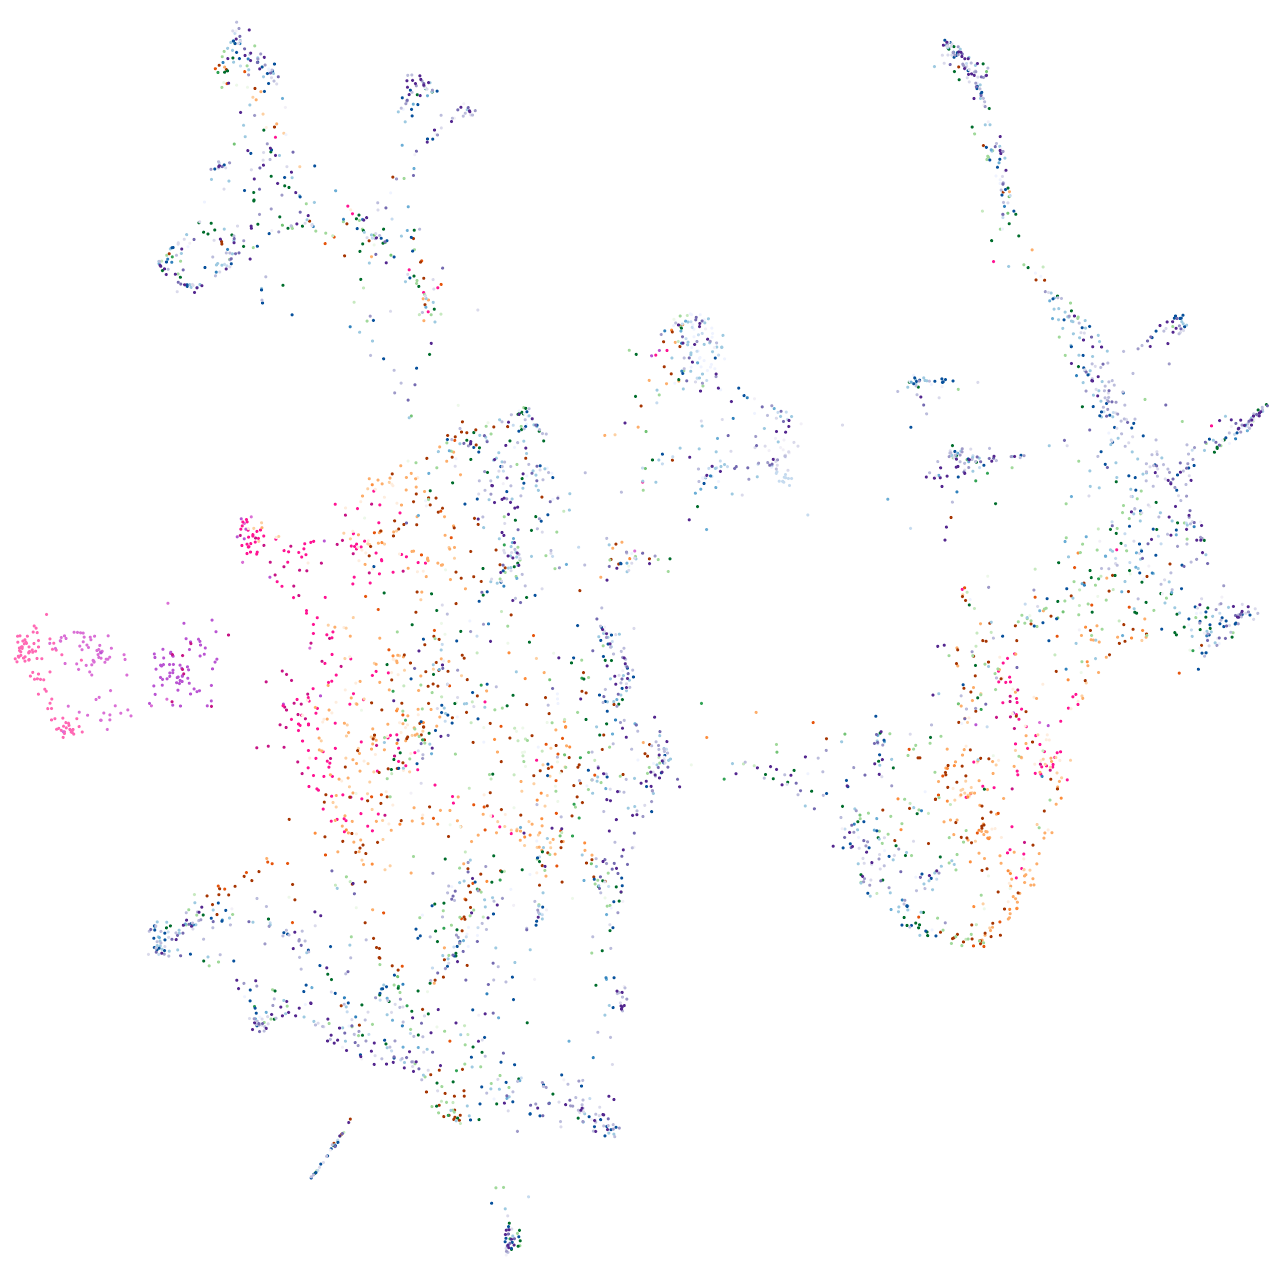
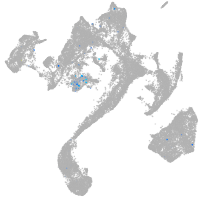
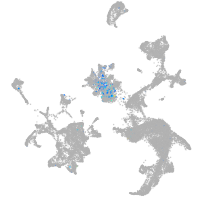
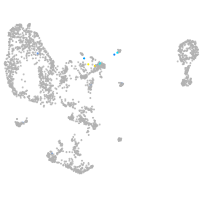
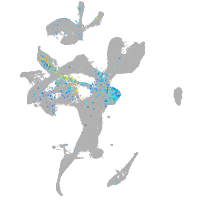
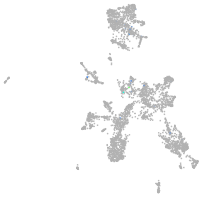
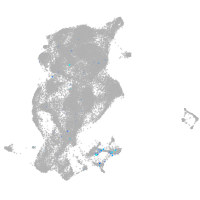
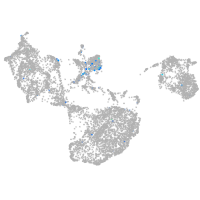
Correlated gene expression
Positive correlation
Negative correlation
Gene
r
Gene
r
si:ch73-233f7.6
0.483
eya1
-0.045
LOC101883236
0.479
six1b
-0.044
XLOC-018000
0.321
atp1b1a
-0.041
olfm3a
0.312
calr3a
-0.039
XLOC-019069
0.273
si:dkey-222f2.1
-0.039
barhl2
0.261
si:ch211-152c2.3
-0.038
SPTBN4
0.258
id1
-0.037
ablim1a
0.255
CABZ01072614.1
-0.035
shox
0.250
f11r.1
-0.035
c7b
0.246
six1a
-0.033
LOC101884401
0.234
her4.1
-0.033
XLOC-043113
0.234
eif4ebp3l
-0.033
mettl8
0.228
angptl4
-0.032
atoh7
0.224
tmem238a
-0.032
zgc:162611
0.224
fosab
-0.032
LOC110439264
0.219
dnase1l4.1
-0.031
XLOC-014477
0.206
fthl27
-0.031
LOC110437856
0.206
spint2
-0.031
si:dkeyp-44d3.1
0.206
si:ch211-286o17.1
-0.031
XLOC-026450
0.206
epcam
-0.030
mab21l1
0.196
pho
-0.030
chka
0.195
ank3b
-0.030
htr1aa
0.190
hey1
-0.030
klhdc8a
0.190
auh
-0.029
illr3
0.188
cxcl14
-0.029
adgrg4a
0.188
arhgef5
-0.028
islr2
0.187
vsig8a
-0.028
wfs1a
0.186
rpl6
-0.028
si:dkey-90a24.1
0.186
tmem30aa
-0.028
pou4f2
0.184
six4a
-0.028
vwc2
0.175
gipc2
-0.028
si:ch73-290k24.5
0.174
prkab1b
-0.028
cacng3b
0.173
si:dkey-222f8.3
-0.028
slitrk3b
0.168
zfp36l1a
-0.027
alk
0.166
akap12b
-0.027