Daniocell
tada2a (periderm)
transcriptional adaptor 2A
ZFIN
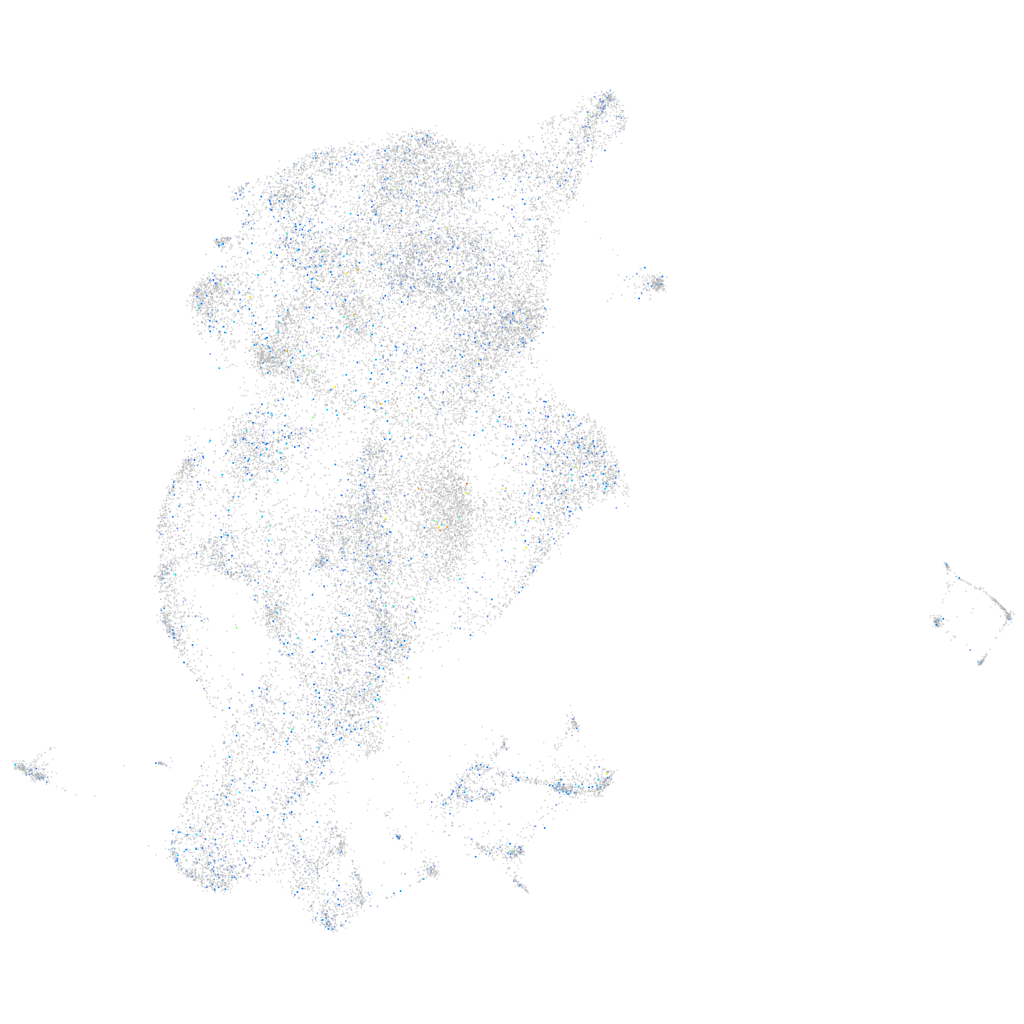
Gene expression UMAP
Display:
Expression
Stage
Other cell groups
all cells
blastomeres
PGCs
endoderm
axial mesoderm
muscle
mural cells /
non-skeletal muscle
mesenchyme
hematopoietic /
vasculature
pronephros
neural
spinal cord / glia
eye
taste / olfactory
otic / lateral line
epidermis
periderm
fin
ionocytes / mucous
pigment cells
Expression by stage/cluster
Correlated gene expression
Positive correlation
Negative correlation
Gene
r
Gene
r
LO018598.1
0.069
icn
-0.031
CU633479.1
0.066
zgc:193505
-0.020
adra2b
0.057
pabpc1a
-0.020
SPATA1
0.057
icn2
-0.018
CU207269.4
0.056
krt4
-0.017
CT027832.1
0.055
mtmr4
-0.016
BX511218.1
0.053
cckb
-0.016
gnb1b
0.052
dock8
-0.015
zgc:162160
0.052
ak1
-0.015
ubxn10
0.050
cdh26.2
-0.015
si:dkey-30j16.3
0.049
cldn17
-0.014
LOC108192140
0.049
CT583728.23
-0.014
gdap1l1
0.049
foxb1b
-0.013
CABZ01117780.1
0.049
soul3
-0.013
f11r.1
0.048
ern2
-0.013
hnrnpaba
0.046
slc1a5
-0.013
pcdh2g3
0.046
FP101887.1
-0.013
hmgn7
0.046
tmem185
-0.013
CU467646.2
0.046
apoda.2
-0.012
sema4gb
0.045
unm-sa1506
-0.012
h2afvb
0.045
supt7l
-0.012
CU571163.1
0.045
rpl38
-0.012
BX927394.1
0.044
rps29
-0.012
tubb2b
0.044
mast3b
-0.011
hmgn2
0.044
LOC108179575
-0.011
khdrbs1a
0.044
wu:fi09b08
-0.011
rxfp3.2a
0.043
si:dkey-16p21.8
-0.011
LOC110438203
0.043
LOC101885394
-0.011
LOC108180065
0.043
bhlhe23
-0.011
rundc3aa
0.043
LOC110439330
-0.011
tmpob
0.043
b3gnt5a
-0.011
CABZ01050249.1
0.043
or123-1
-0.011
zgc:174944
0.043
kctd3
-0.011
rpusd2
0.042
LOC110439786
-0.010
LOC101883201
0.042
stx10
-0.010