Daniocell
tada2a (blastomeres)
transcriptional adaptor 2A
ZFIN
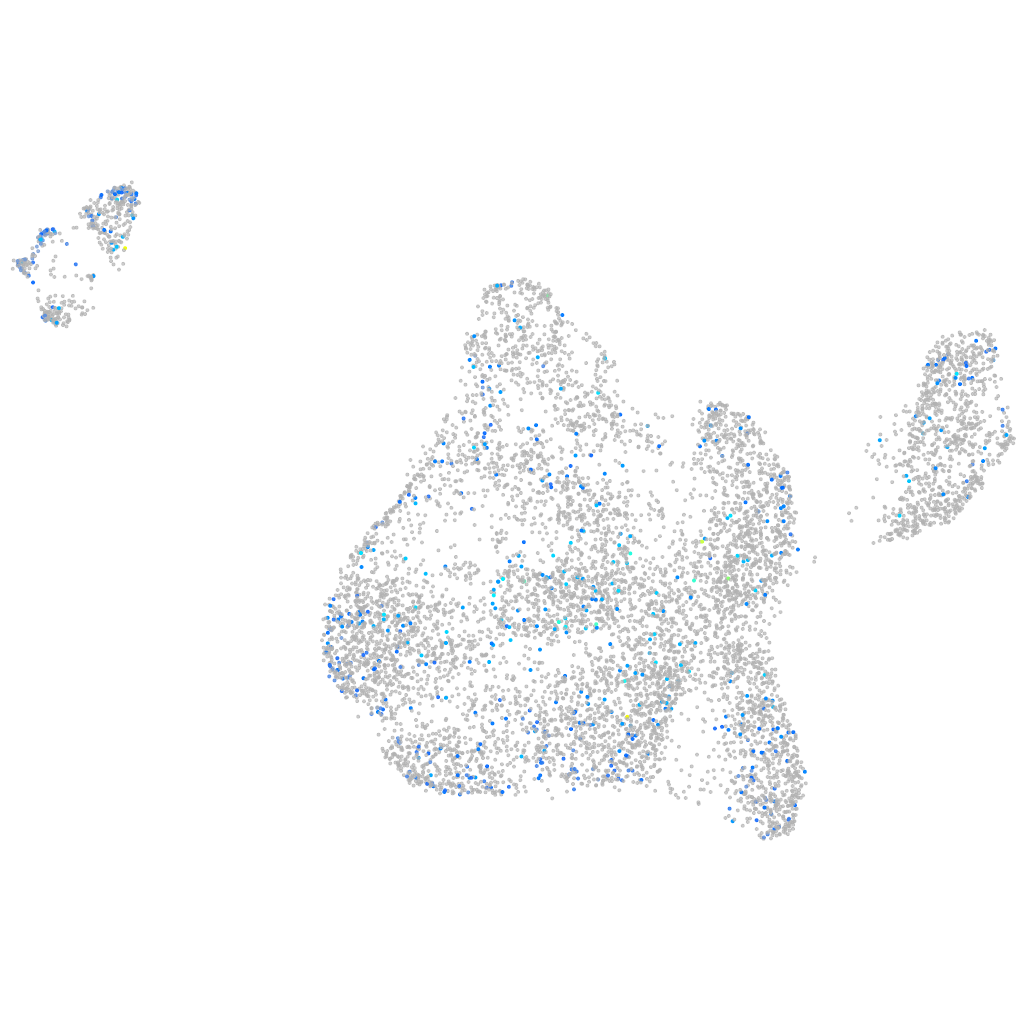
Gene expression UMAP
Display:
Expression
Stage
Other cell groups
all cells
blastomeres
PGCs
endoderm
axial mesoderm
muscle
mural cells /
non-skeletal muscle
mesenchyme
hematopoietic /
vasculature
pronephros
neural
spinal cord / glia
eye
taste / olfactory
otic / lateral line
epidermis
periderm
fin
ionocytes / mucous
pigment cells
Expression by stage/cluster
Correlated gene expression
Positive correlation
Negative correlation
Gene
r
Gene
r
si:dkey-202b22.5
0.092
tbx16
-0.066
LOC103911209
0.082
marcksl1b
-0.055
FP102170.1
0.072
stm
-0.053
zgc:162879
0.072
noto
-0.045
ano10b
0.072
ctcf
-0.040
jag2a
0.070
mplkip
-0.037
LO018238.1
0.069
ccnd1
-0.037
lrrfip1b
0.069
khdrbs1a
-0.035
LOC100332639
0.068
si:ch73-1a9.3
-0.035
scgn
0.068
si:ch73-160h15.3
-0.035
CABZ01069184.1
0.066
rpl29
-0.033
si:dkey-94e7.2
0.066
LOC110437886
-0.032
LOC795083
0.064
zgc:110425
-0.032
oma1
0.064
cirbpb
-0.032
rab36
0.063
rps28
-0.030
si:ch211-266i6.3
0.063
tbxta
-0.030
cacna1sa
0.062
NC-002333.4
-0.030
LOC103911318
0.061
pou5f3
-0.029
si:ch211-147a11.3
0.060
elp4
-0.029
c2cd4a
0.060
akap12b
-0.029
neurod4
0.060
fscn1a
-0.029
ttyh1
0.060
sec61g
-0.028
gata1a
0.060
hnrnpa0b
-0.028
fam131bb
0.059
dis3l2
-0.028
buc2l
0.059
hes6
-0.028
map4k5
0.059
si:dkey-228b2.6
-0.028
XLOC-025051
0.059
si:dkey-151g10.6
-0.027
si:ch211-222k6.1
0.059
znf576.2
-0.027
LO017725.2
0.058
mdka
-0.027
afap1l1a
0.058
arpc1a
-0.027
LOC108182660
0.057
magoh
-0.027
XLOC-014477
0.057
rrp15
-0.027
RF00093
0.057
vcana
-0.027
si:ch211-163g19.2
0.057
CT573239.1
-0.027
BX649377.1
0.057
zfr
-0.026