Daniocell
snai2 (glial cells / spinal cord)
snail family zinc finger 2
ZFIN
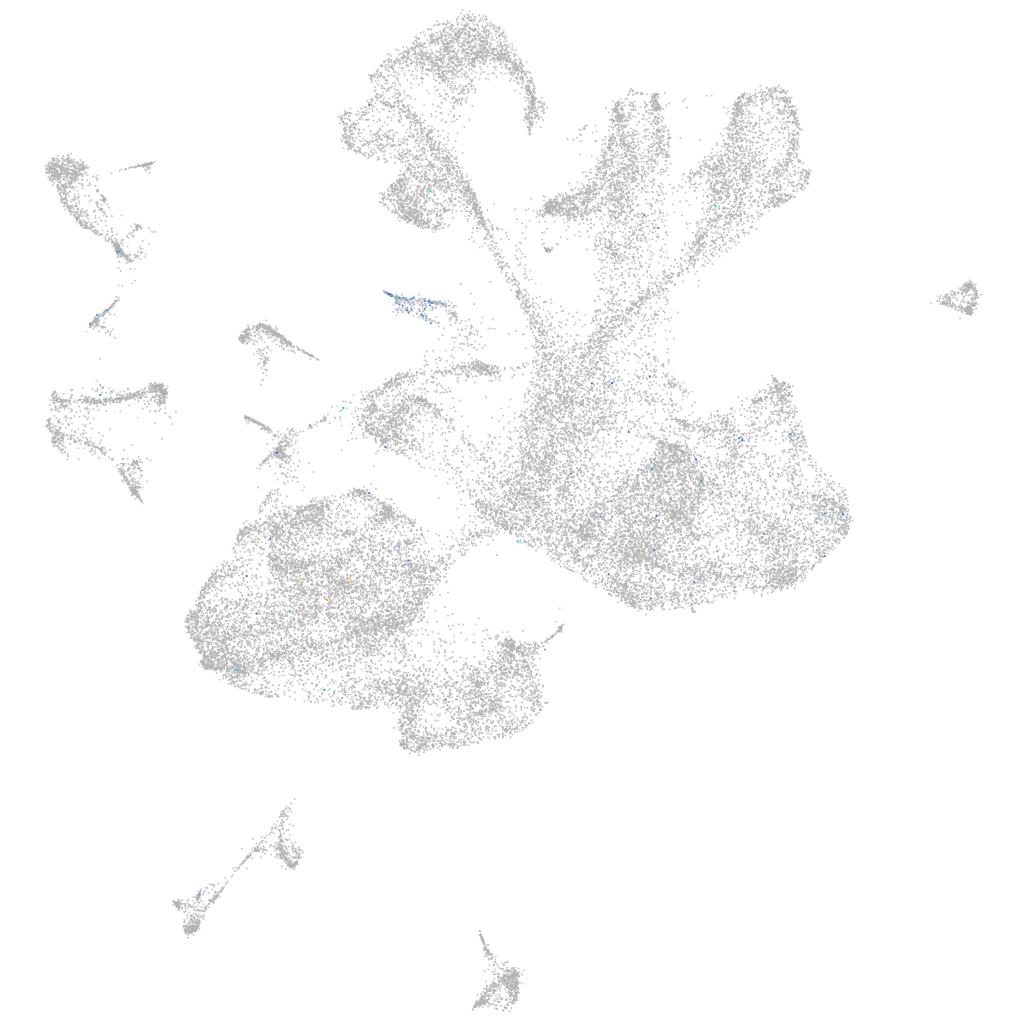
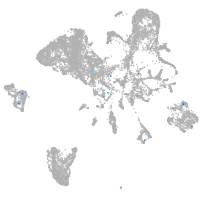
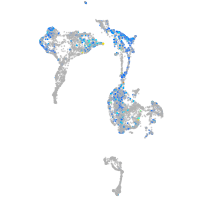
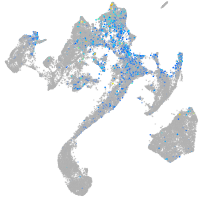
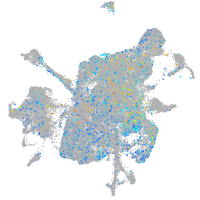
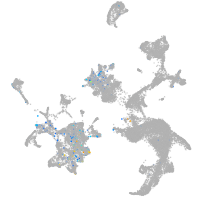
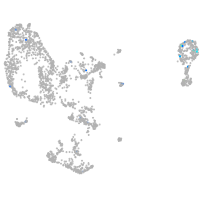
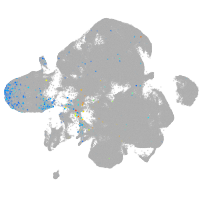
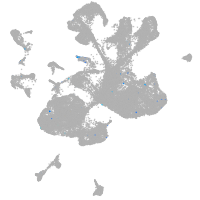
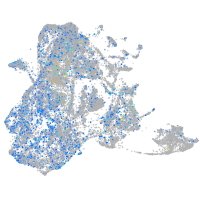
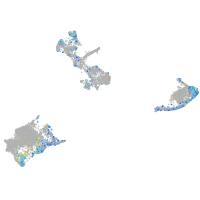
Gene expression UMAP
Display:
Expression
Stage
Other cell groups
all cells
blastomeres
PGCs
endoderm
axial mesoderm
muscle
mural cells /
non-skeletal muscle
mesenchyme
hematopoietic /
vasculature
pronephros
neural
spinal cord / glia
eye
taste / olfactory
otic / lateral line
epidermis
periderm
fin
ionocytes / mucous
pigment cells
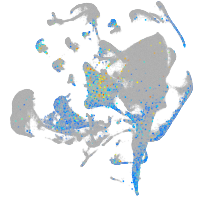
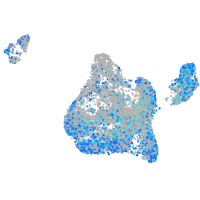
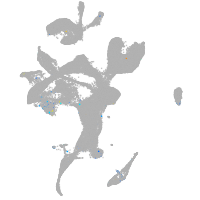
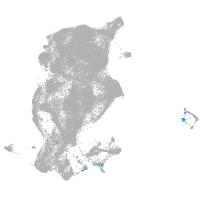
Expression by stage/cluster
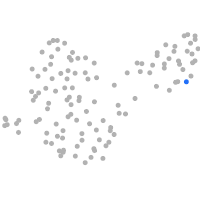
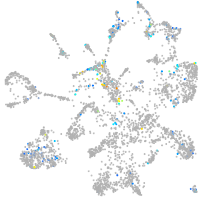
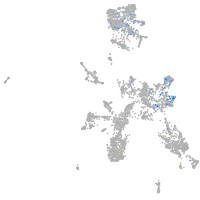
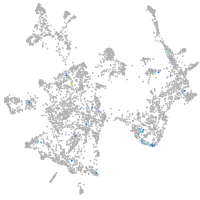
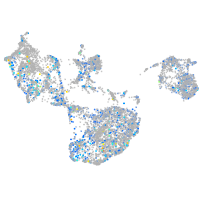
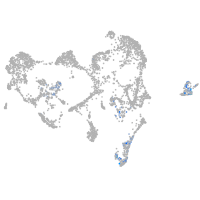
Correlated gene expression
Positive correlation
Negative correlation
Gene
r
Gene
r
CR376748.1
0.193
nova2
-0.029
ednrab
0.145
tuba1c
-0.024
snai1b
0.131
ptmaa
-0.022
BX640522.2
0.120
hmgb1b
-0.022
tfec
0.114
rtn1a
-0.021
crestin
0.113
elavl4
-0.020
LOC110439533
0.101
cadm3
-0.020
si:dkey-238m4.4
0.090
clstn1
-0.020
mc1r
0.088
elavl3
-0.019
nr1h5
0.088
gpm6aa
-0.019
BX649516.2
0.087
hmgb1a
-0.019
kcnj12a
0.087
si:dkey-56m19.5
-0.019
TMEM236
0.085
myt1b
-0.018
CABZ01118767.1
0.084
appb
-0.018
or106-10
0.084
tmsb
-0.018
LOC103910439
0.082
nova1
-0.018
pdgfra
0.081
si:dkey-276j7.1
-0.017
si:ch211-11c3.9
0.080
cplx2
-0.017
nr2e3
0.076
gap43
-0.017
XLOC-041451
0.076
hmgn3
-0.017
RF00377
0.075
vat1
-0.017
XLOC-009861
0.075
pacsin1a
-0.017
BX248318.1
0.071
meis2a
-0.017
BX005442.2
0.069
si:ch211-57n23.4
-0.016
zgc:194336
0.069
dnajc5aa
-0.016
dlc1
0.068
cdk5r1b
-0.016
si:ch211-76m11.15
0.065
elmo1
-0.016
trpm1b
0.064
sox11a
-0.016
si:ch211-11c3.12
0.064
zc4h2
-0.016
trim35-25
0.062
atp6v0cb
-0.016
si:ch211-217a12.1
0.062
map1aa
-0.016
XLOC-013634
0.061
robo2
-0.016
nid2a
0.061
pou2f2a
-0.016
olfml3b
0.061
si:dkeyp-75h12.5
-0.016
CR392012.2
0.060
ankrd12
-0.016