Daniocell
smpd2a (mural cells / non-skeletal muscle)
sphingomyelin phosphodiesterase 2a
ZFIN
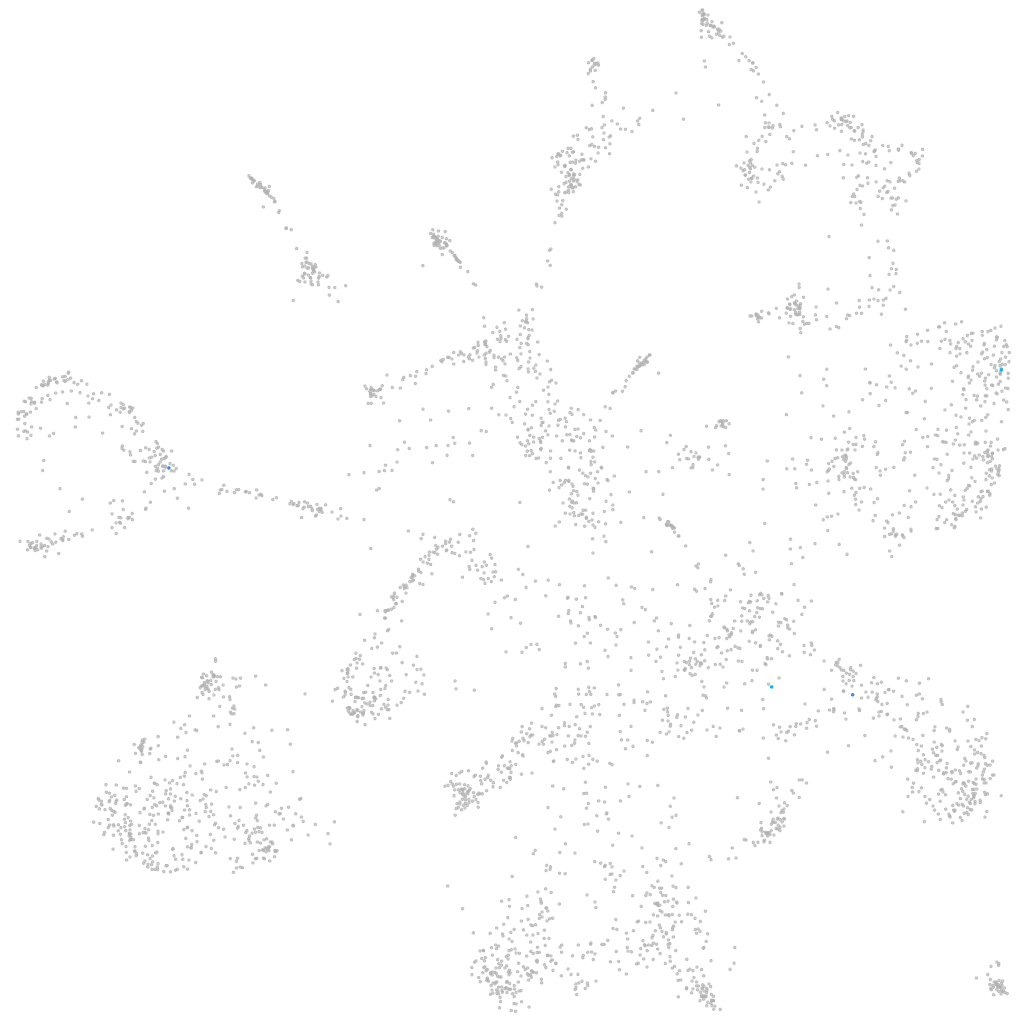
Gene expression UMAP
Display:
Expression
Stage
Other cell groups
all cells
blastomeres
PGCs
endoderm
axial mesoderm
muscle
mural cells /
non-skeletal muscle
mesenchyme
hematopoietic /
vasculature
pronephros
neural
spinal cord / glia
eye
taste / olfactory
otic / lateral line
epidermis
periderm
fin
ionocytes / mucous
pigment cells
Expression by stage/cluster
Correlated gene expression
Positive correlation
Negative correlation
Gene
r
Gene
r
LOC103908985
0.644
ucp2
-0.029
CU682811.2
0.635
tmsb4x
-0.027
XLOC-004195
0.594
id3
-0.026
rad54b
0.426
hspa5
-0.025
tpo
0.390
dynlrb1
-0.023
dnajb13
0.381
tpm4a
-0.023
si:ch211-113d11.5
0.322
sept2
-0.022
LOC101886083
0.312
hmgb1a
-0.021
pih1d2
0.238
zfp36l1a
-0.021
si:ch211-223g7.6
0.230
slc38a5b
-0.021
mkrn2os.1
0.229
ndufb3
-0.021
XLOC-034431
0.222
col6a2
-0.021
si:ch73-7i4.1
0.208
kctd12.2
-0.021
zgc:173480
0.196
tuba8l3
-0.021
SMARCA4
0.190
hist2h2l
-0.020
CABZ01085365.1
0.185
si:ch73-335l21.4
-0.020
nfe2l1a
0.183
XLOC-028370
-0.020
lypc
0.182
emd
-0.020
reps2
0.175
ckbb
-0.020
shisa8b
0.174
ifitm1
-0.020
si:ch211-59h6.1
0.168
arpc1a
-0.020
LOC100150038
0.161
mdkb
-0.020
ftr64
0.154
ccng2
-0.020
AL935300.2
0.152
hbbe1.3
-0.020
BX927219.1
0.150
si:ch211-196l7.4
-0.019
CR388077.1
0.148
chac1
-0.019
LOC101885358
0.145
minos1
-0.019
znf993
0.140
smdt1b
-0.019
rhot1b
0.134
grinab
-0.019
si:ch73-299h12.3
0.133
pdgfra
-0.019
dexi
0.133
lasp1
-0.018
zgc:158659
0.133
bcap31
-0.018
cdk10
0.127
igfbp7
-0.018
ccr11.1
0.126
selenow1
-0.018
dhx33
0.123
lrrc17
-0.018