Daniocell
smpd2a (ionocytes / mucous-producing)
sphingomyelin phosphodiesterase 2a
ZFIN
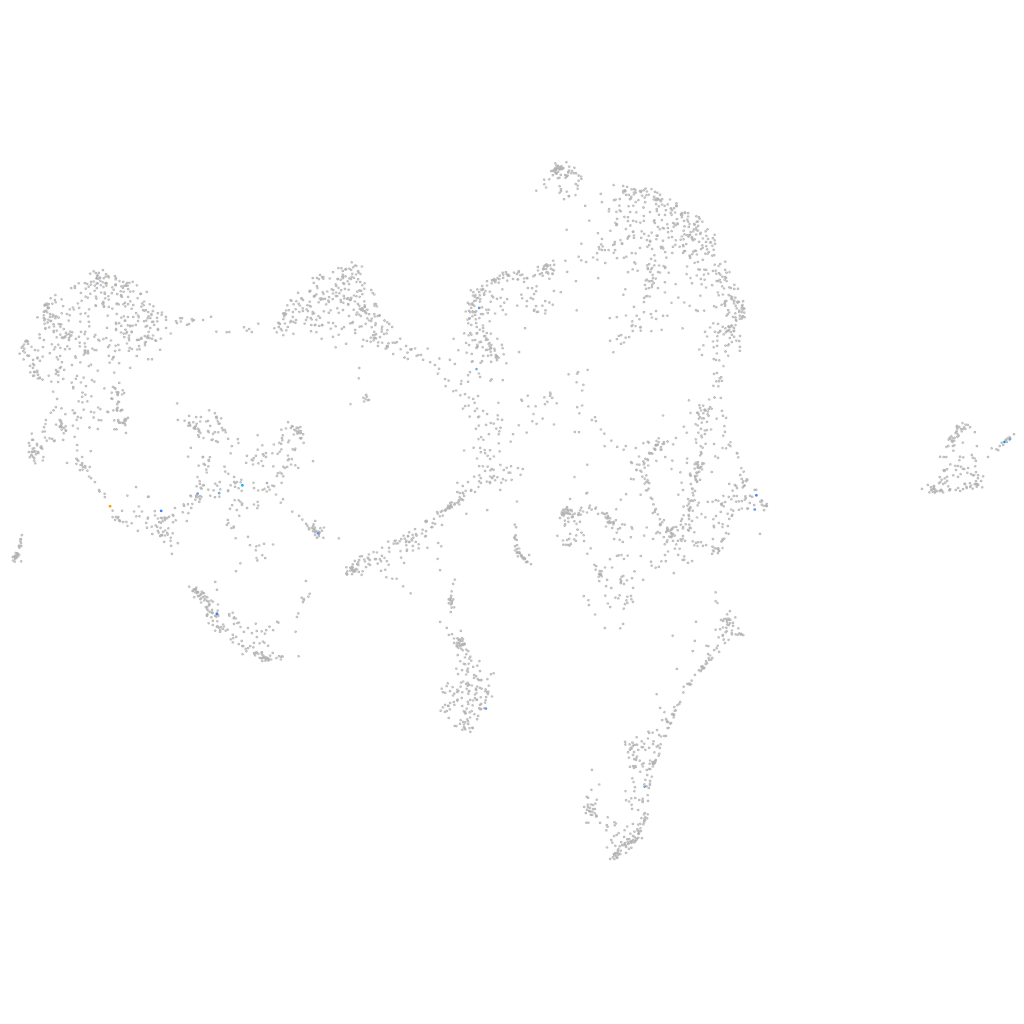
Gene expression UMAP
Display:
Expression
Stage
Other cell groups
all cells
blastomeres
PGCs
endoderm
axial mesoderm
muscle
mural cells /
non-skeletal muscle
mesenchyme
hematopoietic /
vasculature
pronephros
neural
spinal cord / glia
eye
taste / olfactory
otic / lateral line
epidermis
periderm
fin
ionocytes / mucous
pigment cells
Expression by stage/cluster
Correlated gene expression
Positive correlation
Negative correlation
Gene
r
Gene
r
BX649516.4
0.767
rps26l
-0.091
htr2cl1
0.675
rpl28
-0.079
si:ch211-106j21.6
0.665
rpl9
-0.066
mag
0.610
rps3a
-0.060
LOC110439623
0.526
cldnh
-0.058
CABZ01024499.1
0.520
rps4x
-0.057
CABZ01071056.1
0.489
rpl10a
-0.055
si:ch73-299h12.4
0.445
krt91
-0.052
CT583646.2
0.433
rpl15
-0.050
klf12a
0.406
rps3
-0.050
slc6a11a
0.372
rps6
-0.043
TCIM (1 of many)
0.344
rps15
-0.040
LOC110438236
0.326
rpl23
-0.040
zgc:158862
0.324
rps8a
-0.038
LOC101883443
0.308
gnb1a
-0.037
XLOC-035493
0.266
si:dkey-193p11.2
-0.037
si:ch211-149k12.3
0.256
ubc
-0.037
si:ch211-106h11.3
0.256
gmds
-0.036
s1pr2
0.249
cd63
-0.034
clic3
0.248
malb
-0.034
rab15
0.234
si:ch1073-429i10.3.1
-0.034
spns2
0.218
rps2
-0.034
hcn4l
0.215
jupa
-0.034
mcoln3a
0.207
rpl11
-0.034
tbcd
0.203
ppp1cbl
-0.034
srpk3
0.196
sec61g
-0.033
BX005368.1
0.193
slc25a55a
-0.032
mmp20b
0.192
sypl2a
-0.032
foxo1a
0.186
selenok
-0.032
NC-002333.23
0.185
gnb1b
-0.032
cx28.6
0.175
xbp1
-0.032
gpam
0.172
agr2
-0.031
si:dkey-7i4.5
0.172
atf4b
-0.031
si:ch73-289h5.4
0.171
ptmab
-0.030
CABZ01048666.1
0.167
rpl3
-0.030