Daniocell
smpd2a (fin)
sphingomyelin phosphodiesterase 2a
ZFIN
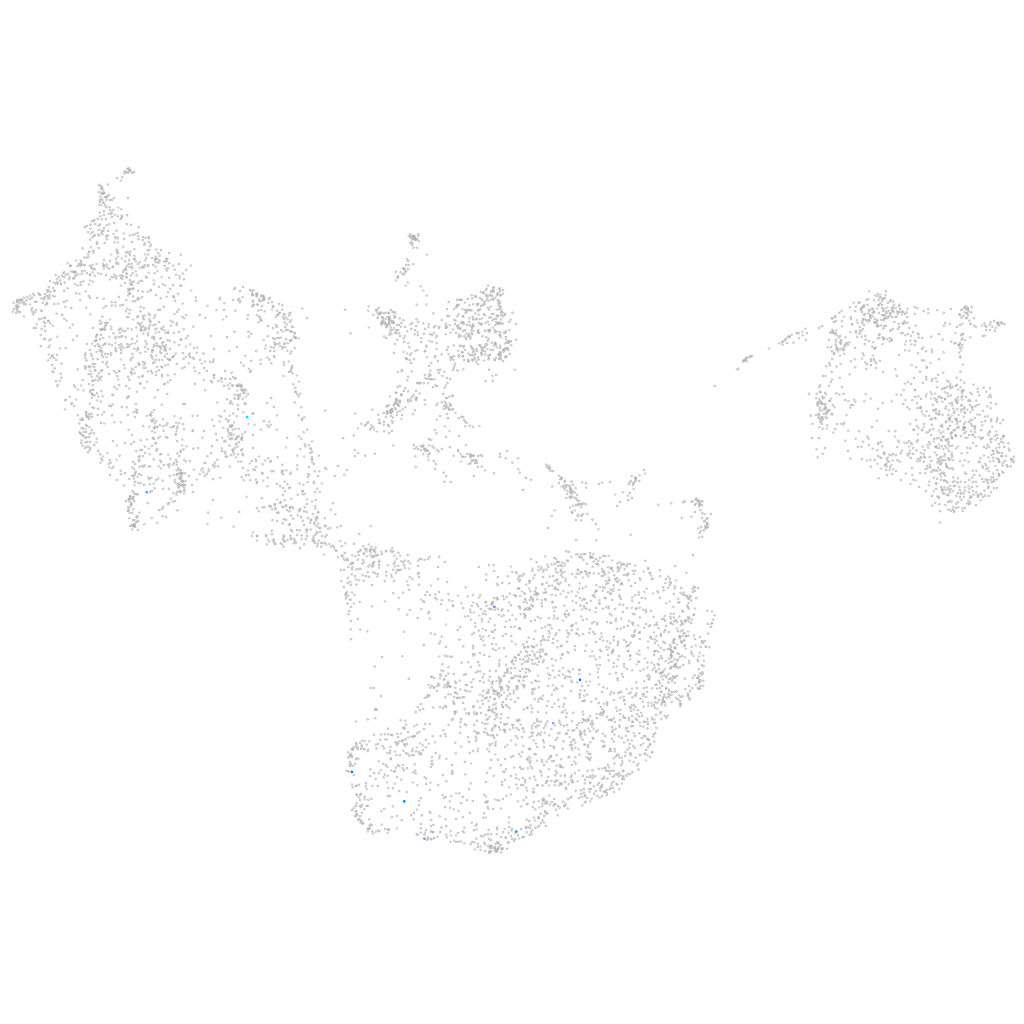
Gene expression UMAP
Display:
Expression
Stage
Other cell groups
all cells
blastomeres
PGCs
endoderm
axial mesoderm
muscle
mural cells /
non-skeletal muscle
mesenchyme
hematopoietic /
vasculature
pronephros
neural
spinal cord / glia
eye
taste / olfactory
otic / lateral line
epidermis
periderm
fin
ionocytes / mucous
pigment cells
Expression by stage/cluster
Correlated gene expression
Positive correlation
Negative correlation
Gene
r
Gene
r
LOC110439512
0.487
and2
-0.026
CU019562.3
0.319
ahcy
-0.023
si:ch211-171h4.7
0.288
col5a1
-0.023
BX005032.1
0.271
bhmt
-0.022
pimr185
0.264
si:dkey-16p21.8
-0.022
CABZ01074888.1
0.225
bud31
-0.022
bcl3
0.217
pdhb
-0.022
pimr55
0.206
coa6
-0.022
cdkn2c
0.204
cdc37
-0.021
def6b
0.189
mrps36
-0.021
LOC110437841
0.186
aimp1
-0.021
mir24-3
0.186
postnb
-0.020
XLOC-032845
0.185
cops4
-0.020
XLOC-028807
0.184
cox7a2l
-0.020
kcnh5b
0.184
krtt1c19e
-0.020
XLOC-025455
0.170
col1a2
-0.020
LOC108181524
0.169
txndc9
-0.019
ttll2
0.158
txn
-0.019
si:dkey-30h22.11
0.158
pon3.2
-0.019
si:ch73-144l3.1
0.157
gdi2
-0.019
hapln4
0.155
magoh
-0.019
LOC110437825
0.155
eif3ba
-0.019
zgc:113227
0.155
zgc:92744
-0.019
LOC101885638
0.151
ndrg2
-0.019
si:ch211-238e22.8
0.146
uqcrh
-0.019
LOC108181080
0.146
eif4ebp3
-0.019
habp2
0.142
si:ch73-86n18.1
-0.019
BX469918.1
0.140
meis1b
-0.019
si:ch211-250m6.2
0.138
anxa3b
-0.019
ASS1
0.133
slc3a2b
-0.019
si:dkey-98f17.3
0.131
pim1
-0.018
CABZ01117603.1
0.131
si:zfos-1192g2.3
-0.018
LOC108185170
0.126
jpt1b
-0.018
FP325130.1
0.124
gstr
-0.018
mttp
0.122
meaf6
-0.018