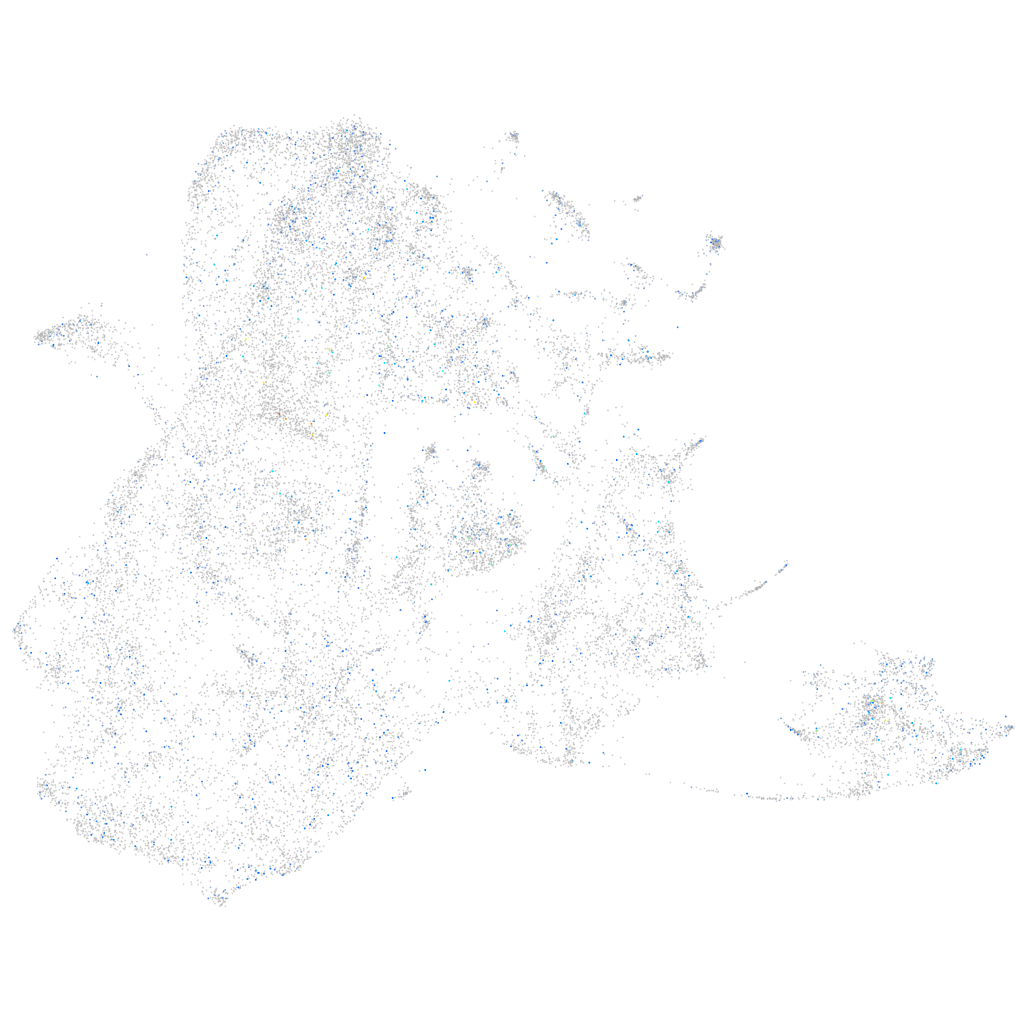
Daniocell
si:dkeyp-115e12.7 (epidermis)
si:dkeyp-115e12.7
ZFIN
Gene expression UMAP
Display:
Expression
Stage
Other cell groups
all cells
blastomeres
PGCs
endoderm
axial mesoderm
muscle
mural cells /
non-skeletal muscle
mesenchyme
hematopoietic /
vasculature
pronephros
neural
spinal cord / glia
eye
taste / olfactory
otic / lateral line
epidermis
periderm
fin
ionocytes / mucous
pigment cells
Expression by stage/cluster
Correlated gene expression
Positive correlation
Negative correlation
Gene
r
Gene
r
XLOC-043762
0.070
rps12
-0.041
cyp19a1a
0.067
snrpd1
-0.038
si:ch211-160o17.6
0.067
seta
-0.037
si:ch211-271e10.1
0.067
hmga1a
-0.037
zgc:175177
0.065
cnbpa
-0.036
si:ch211-160d20.5
0.062
snrpd2
-0.035
pnrc2
0.061
rps23
-0.035
si:ch211-212k18.6
0.060
zgc:153675
-0.033
mmp16b
0.058
rps5
-0.033
LOC110438260
0.058
si:ch73-281n10.2
-0.033
il20ra
0.056
snrpg
-0.032
CR774179.5
0.056
hmgb2b
-0.032
LO018250.1
0.056
nop58
-0.032
CR762470.1
0.056
snu13b
-0.032
klf3
0.055
snrpe
-0.032
LOC108187081
0.054
dut
-0.031
sesn1
0.053
si:ch211-288g17.3
-0.031
foxo1b
0.053
cbx3a
-0.031
sh3d19
0.052
rplp2l
-0.031
si:dkeyp-97a10.3
0.052
ptgr1
-0.031
b2ml
0.052
snrpf
-0.031
ftr76
0.051
si:ch211-222l21.1
-0.031
LOC110438251
0.051
fen1
-0.031
CR383676.1
0.051
rpl21
-0.031
spint2
0.051
rbbp4
-0.030
ftr37
0.051
lsm7
-0.030
si:ch211-106j21.2
0.050
npm1a
-0.030
LO017848.1
0.050
rpl17
-0.029
xkr5a
0.050
rpl39
-0.029
si:dkey-205h13.1
0.050
tubb2b
-0.029
CR926130.1
0.050
hnrnpl2
-0.029
creld1a
0.050
snrpb
-0.029
LOC101886884
0.050
nucks1a
-0.029
mpeg1.1
0.050
psat1
-0.029
CU062645.1
0.050
h2afvb
-0.029