Daniocell
si:dkeyp-115e12.7 (blastomeres)
si:dkeyp-115e12.7
ZFIN
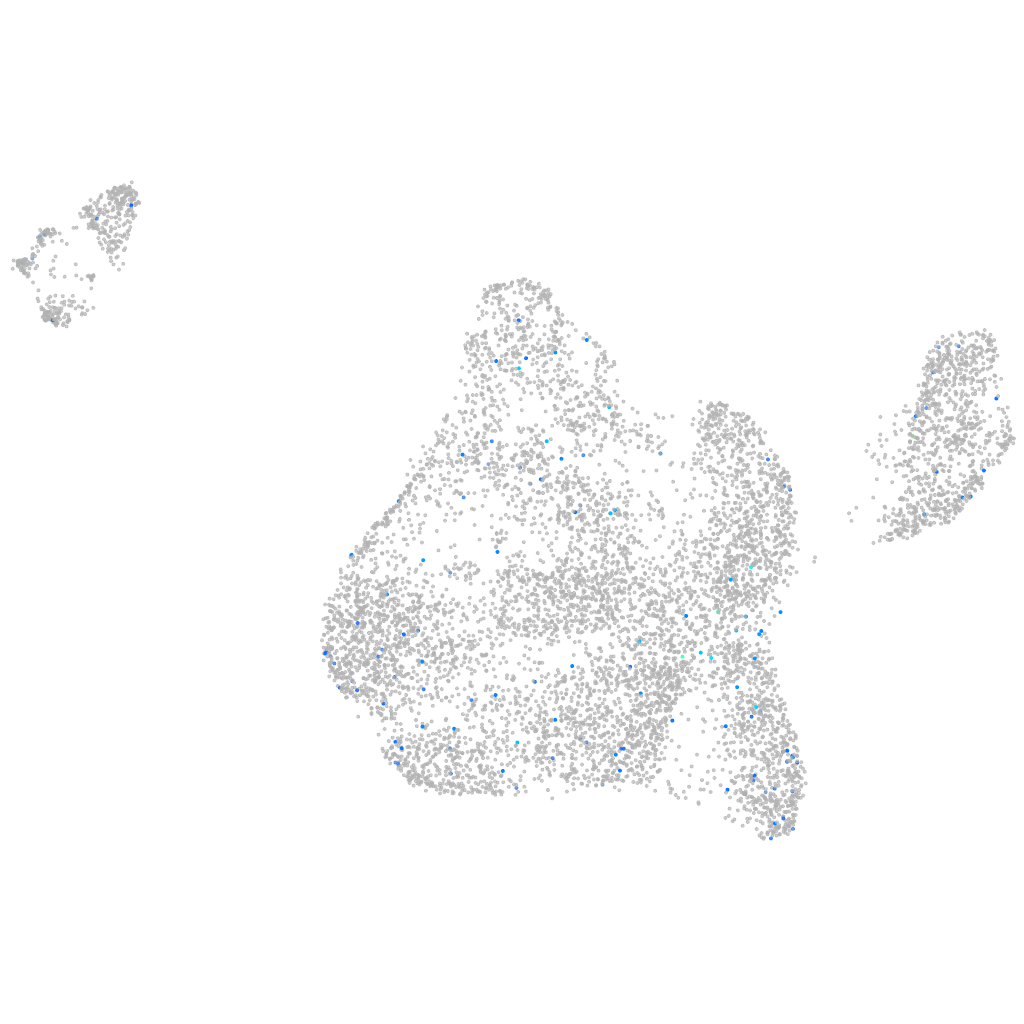
Gene expression UMAP
Display:
Expression
Stage
Other cell groups
all cells
blastomeres
PGCs
endoderm
axial mesoderm
muscle
mural cells /
non-skeletal muscle
mesenchyme
hematopoietic /
vasculature
pronephros
neural
spinal cord / glia
eye
taste / olfactory
otic / lateral line
epidermis
periderm
fin
ionocytes / mucous
pigment cells
Expression by stage/cluster
Correlated gene expression
Positive correlation
Negative correlation
Gene
r
Gene
r
si:dkeyp-4c4.2
0.197
ucp2
-0.039
BX324146.1
0.137
h3f3d
-0.037
si:dkey-9i23.6
0.120
ostc
-0.031
lcp2a
0.118
selenot1b
-0.031
si:ch211-205a14.1
0.107
mt-co2
-0.030
rsph10b
0.103
si:dkey-9c18.3
-0.029
obscnb
0.099
psmd8
-0.029
fam149b1
0.097
gnb1b
-0.029
ostn
0.095
golga7
-0.028
ANO7
0.095
ccnf
-0.028
zbtb7c
0.094
glipr2l
-0.028
LOC108179642
0.093
ube2d1a
-0.028
LOC101884845
0.093
rap1aa
-0.027
swap70a
0.086
nudt1
-0.027
LOC101882800
0.085
rabl6b
-0.027
si:ch211-176g13.8
0.083
atg9b
-0.027
FO904898.6
0.083
gtf2h5
-0.026
LOC103909736
0.083
cdc42l
-0.026
kcnc1b
0.083
rbm8a
-0.026
ANPEP
0.082
rae1
-0.025
lrrc9
0.081
rbb4l
-0.025
si:dkeyp-73a2.2
0.080
sec61b
-0.025
XLOC-042938
0.079
calm2a
-0.025
slitrk4
0.079
thap11
-0.025
CABZ01030017.1
0.079
s100a1
-0.025
BX511265.3
0.078
cox7b
-0.025
epor
0.077
si:dkey-16p21.8
-0.025
LOC101883873
0.077
ywhabb
-0.025
usp54b
0.076
mrpl22
-0.024
si:ch211-252f13.5
0.076
smarcb1b
-0.024
nxnl1
0.075
slc39a1
-0.024
BX571952.1
0.074
naa20
-0.024
csf1rb
0.074
foxi1
-0.024
CU640433.1
0.074
si:ch73-248e21.1
-0.024
itga9
0.074
mt-cyb
-0.024