Daniocell
si:dkey-62k3.5 (pigment cells)
si:dkey-62k3.5
ZFIN
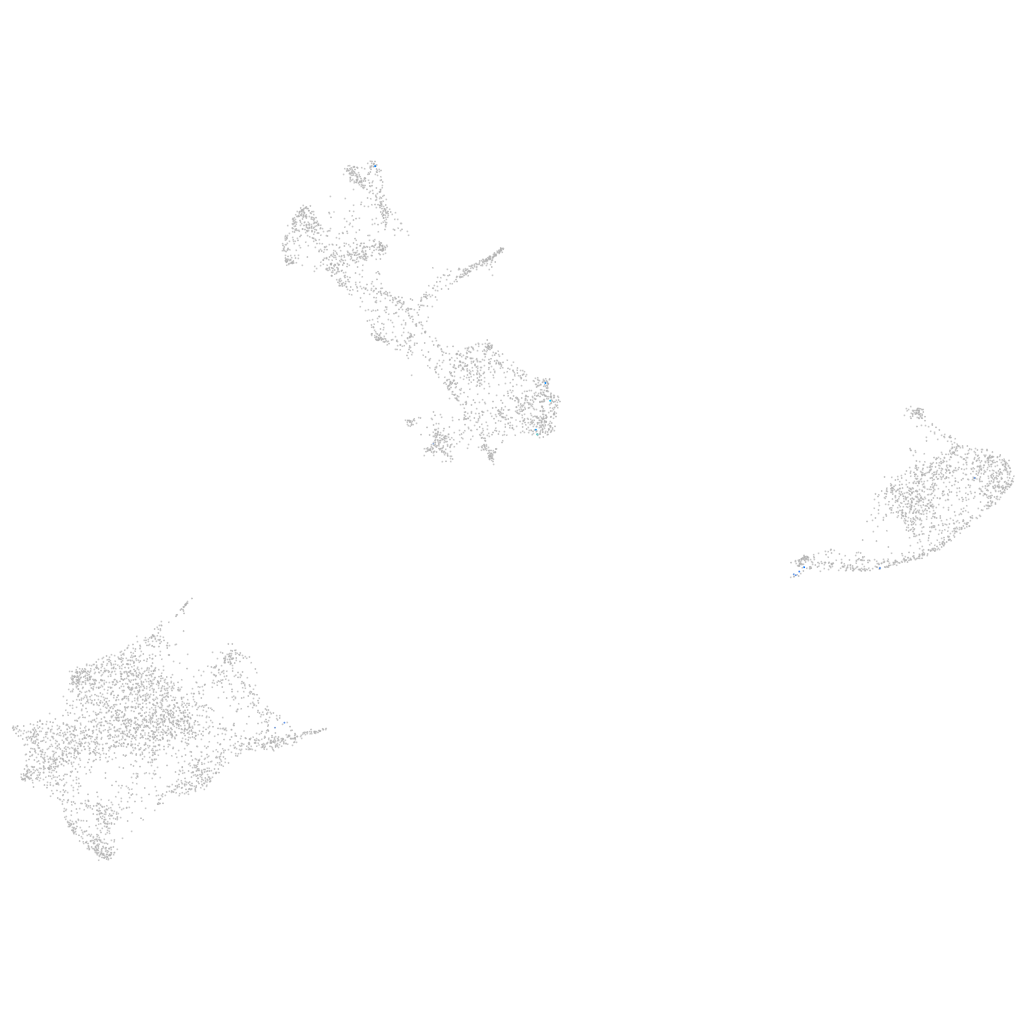
Gene expression UMAP
Display:
Expression
Stage
Other cell groups
all cells
blastomeres
PGCs
endoderm
axial mesoderm
muscle
mural cells /
non-skeletal muscle
mesenchyme
hematopoietic /
vasculature
pronephros
neural
spinal cord / glia
eye
taste / olfactory
otic / lateral line
epidermis
periderm
fin
ionocytes / mucous
pigment cells
Expression by stage/cluster
Correlated gene expression
Positive correlation
Negative correlation
Gene
r
Gene
r
LOC100005723
0.433
si:dkey-151g10.6
-0.028
BX511079.1
0.388
gstp1
-0.026
CABZ01117603.1
0.383
slc2a15a
-0.024
CU856222.1
0.332
prdx5
-0.023
zgc:123299
0.329
si:dkey-251i10.2
-0.023
si:ch211-195j11.30
0.288
zgc:110339
-0.022
btr02
0.269
rplp1
-0.022
AL929105.1
0.251
phyhd1
-0.021
CR932000.1
0.247
ahnak
-0.021
grin3ba
0.240
hbbe1.3
-0.021
kcnj3b
0.239
eef1da
-0.020
sim1b
0.235
uraha
-0.020
CABZ01060030.1
0.231
si:dkeyp-66d1.7
-0.020
wdr47a
0.228
itm2ba
-0.020
XLOC-018389
0.203
ppt1
-0.019
cacnb3b
0.197
fabp7a
-0.019
pyya
0.194
tmem130
-0.019
si:ch73-30l9.1
0.191
bco1
-0.019
si:dkey-206p8.1
0.189
rps14
-0.019
qpctlb
0.188
ndufa2
-0.019
lrp11
0.187
rbp4l
-0.018
ky
0.187
icn2
-0.017
LOC103909803
0.187
pfn1
-0.017
tacr2
0.186
anxa5b
-0.017
XLOC-035103
0.177
aldh16a1
-0.017
plppr3b
0.176
cst3
-0.017
AGBL1
0.174
rps19
-0.017
rims3
0.174
hbbe1.2
-0.017
si:ch73-383g2.1
0.174
XLOC-019062
-0.017
st6galnac6
0.172
pmp22b
-0.017
kctd20
0.170
prdx1
-0.017
kcnc3b
0.167
txn
-0.017
wif1
0.166
rplp2l
-0.017
LO017843.1
0.165
cdc42se1
-0.017
zgc:194312
0.163
bscl2l
-0.016