Daniocell
si:dkey-62k3.5 (eye)
si:dkey-62k3.5
ZFIN
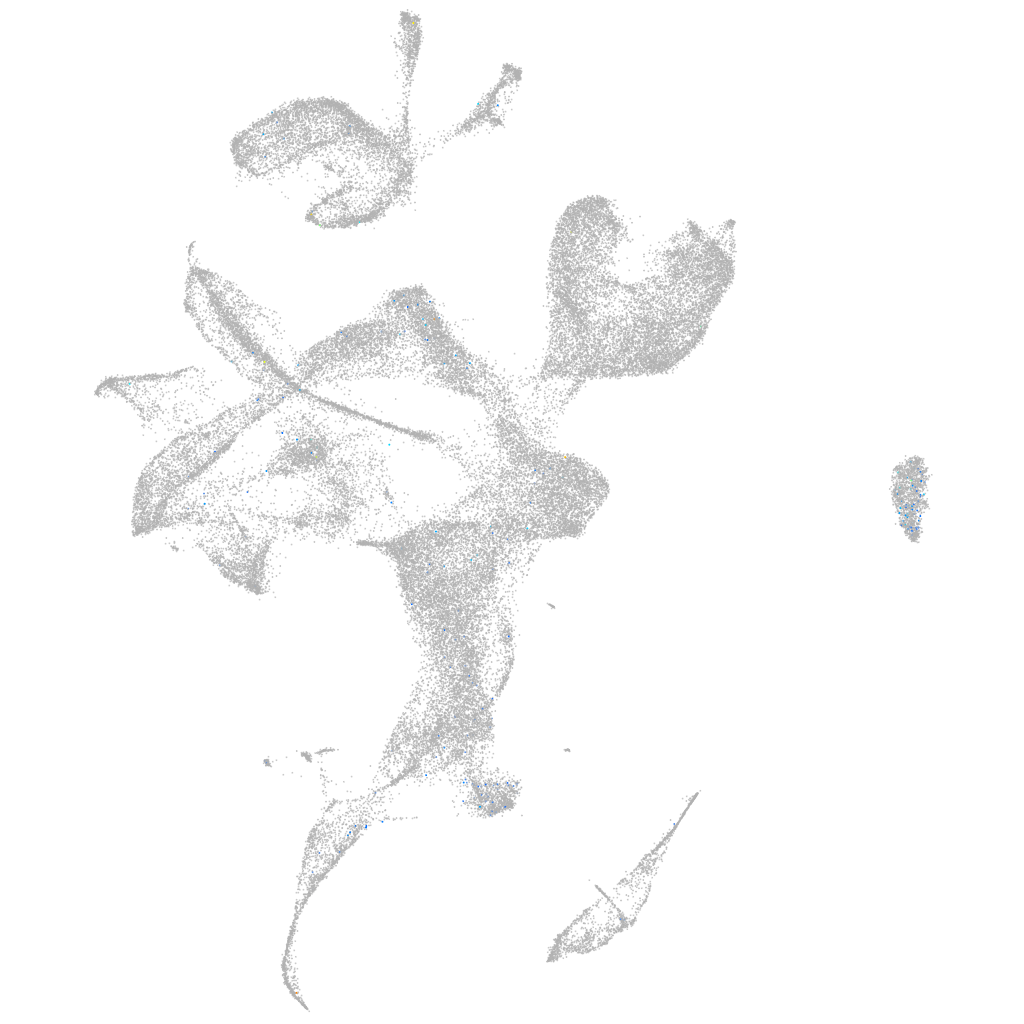
Gene expression UMAP
Display:
Expression
Stage
Other cell groups
all cells
blastomeres
PGCs
endoderm
axial mesoderm
muscle
mural cells /
non-skeletal muscle
mesenchyme
hematopoietic /
vasculature
pronephros
neural
spinal cord / glia
eye
taste / olfactory
otic / lateral line
epidermis
periderm
fin
ionocytes / mucous
pigment cells
Expression by stage/cluster
Correlated gene expression
Positive correlation
Negative correlation
Gene
r
Gene
r
BX088705.1
0.110
CR383676.1
-0.037
CABZ01033205.1
0.099
COX3
-0.033
XLOC-028453
0.088
mt-co2
-0.032
LOC103910874
0.087
rps10
-0.029
XLOC-025426
0.085
ppiab
-0.029
FP236457.1
0.083
gpm6aa
-0.027
LOC103910826
0.078
ptmaa
-0.025
LOC110438010
0.072
mt-nd1
-0.025
si:dkey-11o15.10
0.070
marcksl1a
-0.024
hspb1
0.070
actc1b
-0.024
LOC101882309
0.068
zgc:114188
-0.024
shisa2a
0.067
mt-atp6
-0.024
tdrd12
0.065
rpl37
-0.023
si:dkey-152b24.8
0.065
pvalb1
-0.021
aldob
0.065
hnrnpa0l
-0.021
lactb2
0.064
rnasekb
-0.021
dao.3
0.063
ckbb
-0.021
ankef1a
0.063
atp5f1b
-0.020
LOC100329825
0.062
mt-cyb
-0.020
stm
0.062
pvalb2
-0.020
pou5f3
0.061
gpm6ab
-0.019
LOC101885806
0.061
syt5b
-0.019
sox19a
0.060
btg1
-0.019
CABZ01063602.1
0.058
gng13b
-0.019
nitr3c
0.058
gnb3a
-0.019
hesx1
0.057
mid1ip1b
-0.019
tdgf1
0.057
tnni2a.4
-0.018
si:ch1073-80i24.3
0.057
h3f3a
-0.018
apoeb
0.056
mylpfa
-0.018
si:ch211-167j6.3
0.056
si:ch1073-429i10.3.1
-0.018
si:dkeyp-3f10.16
0.056
ndrg4
-0.018
si:ch211-152c2.3
0.056
rs1a
-0.018
cyp26a1
0.055
rps17
-0.018
LOC103911814
0.054
zgc:158463
-0.018
apoc1
0.054
epb41a
-0.018