Daniocell
si:dkey-62k3.5 (periderm)
si:dkey-62k3.5
ZFIN
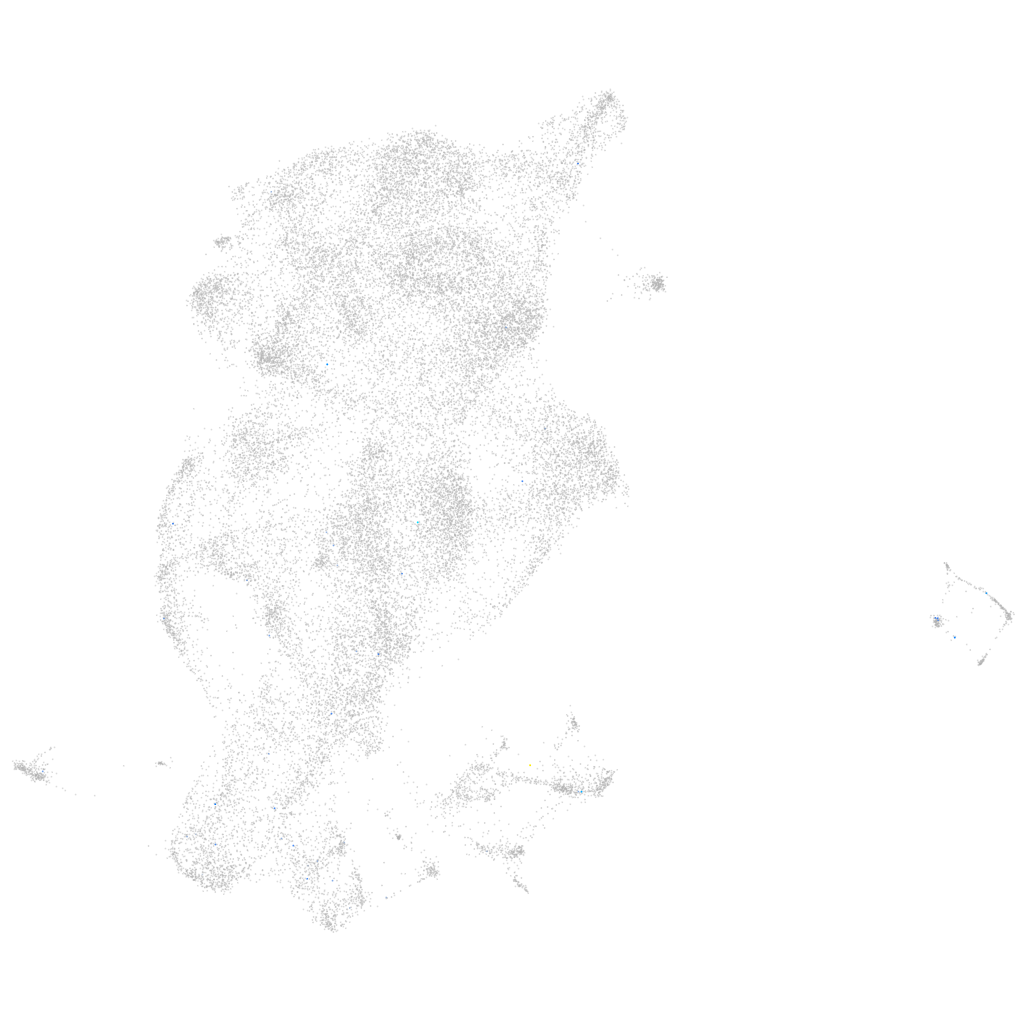
Gene expression UMAP
Display:
Expression
Stage
Other cell groups
all cells
blastomeres
PGCs
endoderm
axial mesoderm
muscle
mural cells /
non-skeletal muscle
mesenchyme
hematopoietic /
vasculature
pronephros
neural
spinal cord / glia
eye
taste / olfactory
otic / lateral line
epidermis
periderm
fin
ionocytes / mucous
pigment cells
Expression by stage/cluster
Correlated gene expression
Positive correlation
Negative correlation
Gene
r
Gene
r
BX649490.4
0.260
rplp0
-0.033
ENKD1
0.214
rps3a
-0.029
XLOC-039714
0.189
rps25
-0.029
qkib
0.188
rpl13
-0.028
LOC101884314
0.187
rps10
-0.027
BX545855.1
0.179
rpl37
-0.026
her4.3
0.155
icn2
-0.026
llgl1
0.143
uba52
-0.026
CABZ01053748.1
0.138
cyt1
-0.025
galr1b
0.137
scel
-0.024
gli3
0.135
si:ch211-207n23.2
-0.024
AL928707.2
0.135
rplp2
-0.024
RF00577
0.135
si:dkey-247k7.2
-0.023
si:dkey-261o4.9
0.132
wu:fa03e10
-0.022
gpr37l1a
0.130
rps17
-0.021
ephx4
0.130
eevs
-0.021
plppr5b
0.126
rpl26
-0.021
BX927121.1
0.125
slc38a5b
-0.021
sall2
0.123
rpl7a
-0.021
BX004768.1
0.120
zgc:111983
-0.021
LOC108181225
0.119
tob1b
-0.020
si:ch211-137j23.8
0.115
si:dkeyp-51b9.3
-0.020
CR788316.3
0.110
chac1
-0.020
si:dkey-24p1.1
0.107
eef1g
-0.020
zgc:66433
0.107
rps23
-0.020
CACNA2D1
0.106
pvalb1
-0.019
mybpc2a
0.105
rpl18a
-0.019
si:dkey-237g15.2
0.103
zgc:114188
-0.019
egr2b
0.100
rps26l
-0.019
tmem145
0.099
tcnbb
-0.018
si:dkey-78o7.3
0.098
tdh
-0.018
LOC100333807
0.097
rpl5a
-0.018
npas1
0.097
rps5
-0.018
tdrd7a
0.096
selenow1
-0.018
LOC101882875
0.095
foxq1a
-0.018