Daniocell
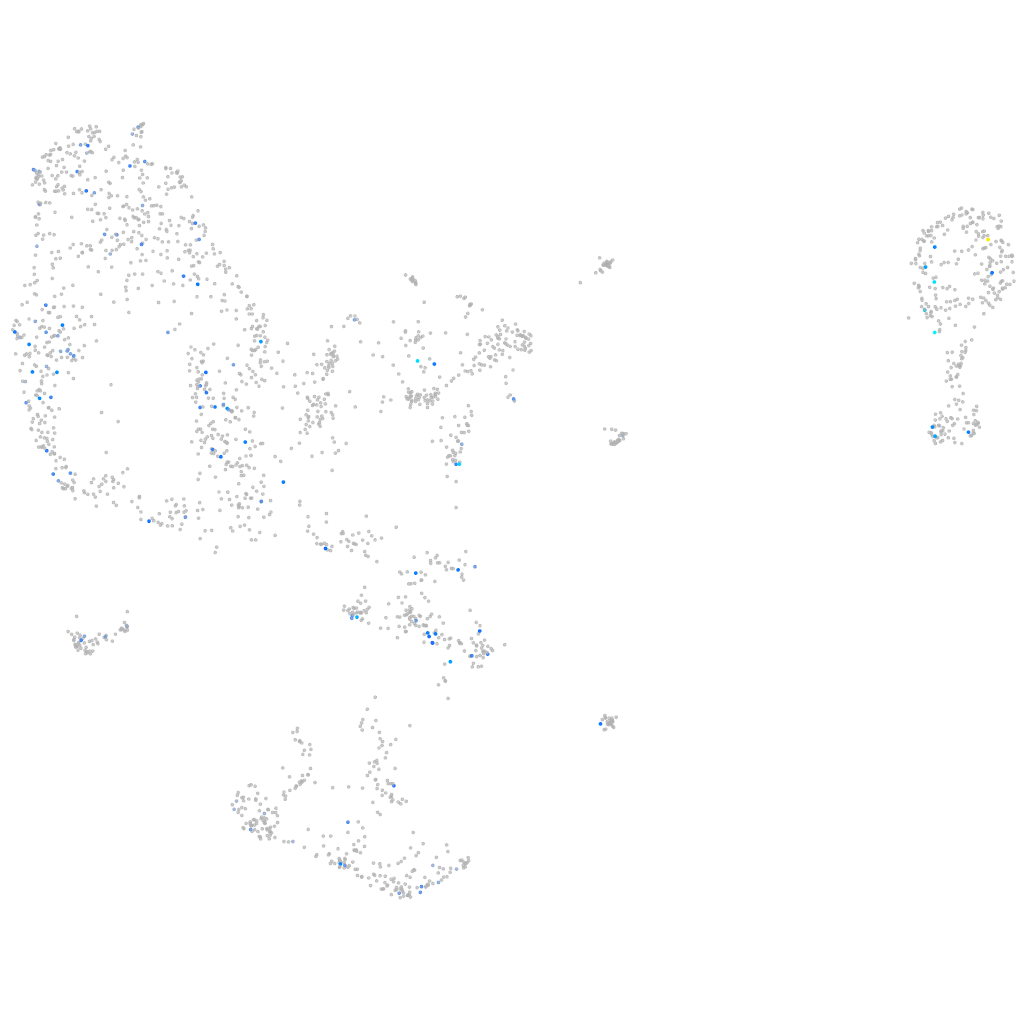
rhbdd2 (pronephros)
rhomboid domain containing 2
ZFIN
Gene expression UMAP
Display:
Expression
Stage
Other cell groups
all cells
blastomeres
PGCs
endoderm
axial mesoderm
muscle
mural cells /
non-skeletal muscle
mesenchyme
hematopoietic /
vasculature
pronephros
neural
spinal cord / glia
eye
taste / olfactory
otic / lateral line
epidermis
periderm
fin
ionocytes / mucous
pigment cells
Expression by stage/cluster
Correlated gene expression
Positive correlation
Negative correlation
Gene
r
Gene
r
BX547934.2
0.289
fam168b
-0.053
asic1a
0.205
ptena
-0.049
XLOC-021259
0.205
tpma
-0.047
CABZ01067232.1
0.191
rtn1a
-0.046
BX649516.3
0.187
elavl4
-0.046
mir30a
0.184
gapdhs
-0.046
si:dkey-264d12.5
0.177
si:dkeyp-75h12.5
-0.046
CT033842.1
0.176
atp6v0cb
-0.045
CU655845.1
0.176
tnrc6c1
-0.044
BX001026.1
0.174
kdm6bb
-0.044
si:dkey-261j4.4
0.173
nova1
-0.043
LOC101884995
0.167
RAB19
-0.042
si:ch211-229d2.5
0.162
ighmbp2
-0.042
si:dkey-27o4.1
0.156
apc
-0.042
arsg
0.155
malb
-0.042
LOC100147871
0.151
kdm2ba
-0.042
fn3krp
0.149
kank2
-0.042
pus3
0.147
gabpb2a
-0.041
AL845362.1
0.145
ccl19a.1
-0.041
LOC108190601
0.144
rtf2
-0.041
lrrc10
0.144
ptpa
-0.041
scn5lab
0.144
trib2
-0.041
znf1013
0.144
nsg2
-0.040
zgc:158689
0.143
dhrs3a
-0.040
inka2
0.143
cep97
-0.040
nectin4a
0.142
cspg5a
-0.040
rcvrnb
0.141
syt1a
-0.040
tacr1b
0.140
elavl3
-0.039
tmem98
0.140
tmsb4x
-0.039
si:dkey-3p4.8
0.140
nck1a
-0.039
ovch2
0.139
tomm40
-0.039
AL954146.1
0.137
mgst2
-0.039
CR391986.1
0.137
gpm6aa
-0.039
si:ch211-194p6.10
0.136
stmn2a
-0.039
si:ch1073-186o8.3
0.136
ephx2
-0.039