Daniocell
rhbdd2 (axial mesoderm)
rhomboid domain containing 2
ZFIN
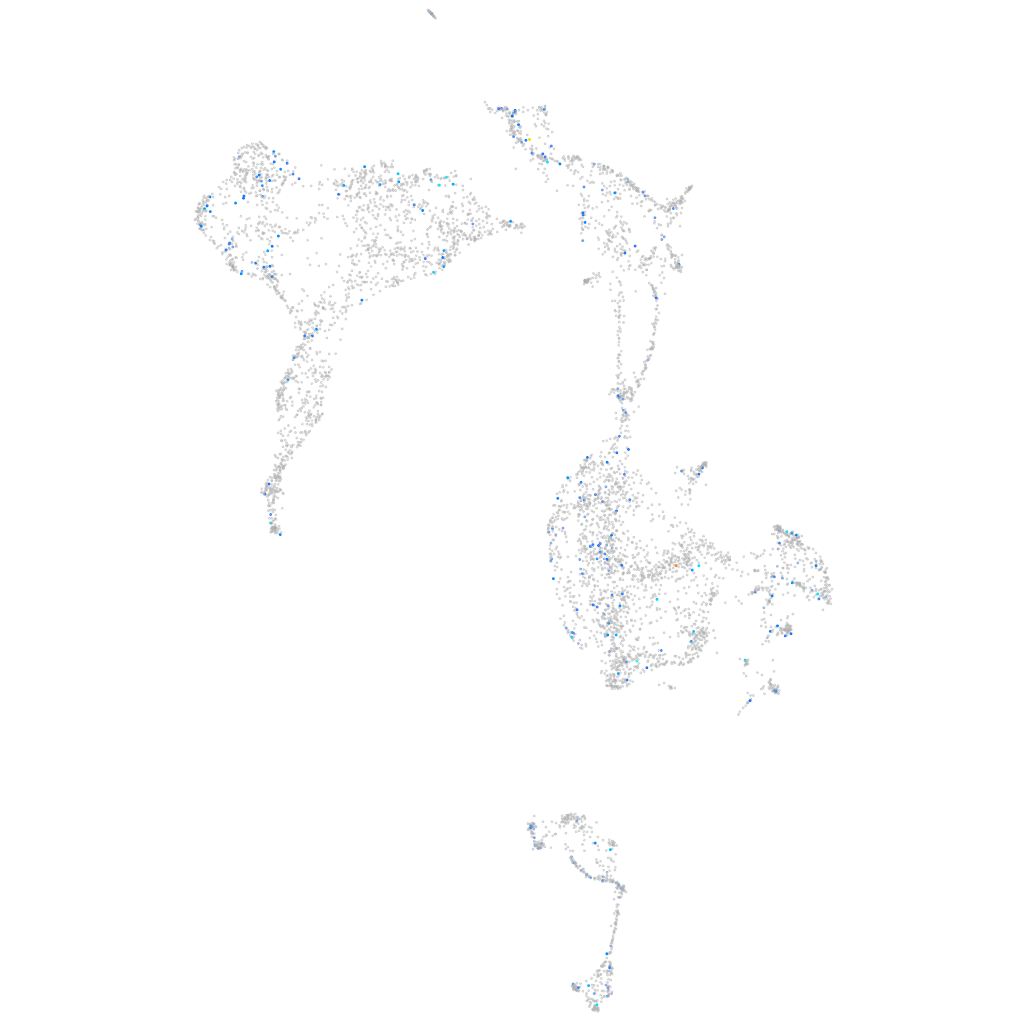
Gene expression UMAP
Display:
Expression
Stage
Other cell groups
all cells
blastomeres
PGCs
endoderm
axial mesoderm
muscle
mural cells /
non-skeletal muscle
mesenchyme
hematopoietic /
vasculature
pronephros
neural
spinal cord / glia
eye
taste / olfactory
otic / lateral line
epidermis
periderm
fin
ionocytes / mucous
pigment cells
Expression by stage/cluster
Correlated gene expression
Positive correlation
Negative correlation
Gene
r
Gene
r
XLOC-019908
0.139
insb
-0.043
FO704779.1
0.136
frzb
-0.035
gcnt3
0.121
ndnl2
-0.034
si:dkey-24c2.7
0.120
rab33a
-0.034
LOC101882645
0.119
fzd8b
-0.033
tmem121ab
0.117
zfand5a
-0.031
CT025909.2
0.114
pum3
-0.030
BX545917.3
0.113
fzd8a
-0.030
LOC101884422
0.111
CABZ01072848.1
-0.029
stap2b
0.111
tbx1
-0.029
CABZ01084617.1
0.109
si:ch211-113a14.24
-0.029
slc26a3.2
0.108
si:ch211-140b10.6
-0.028
si:ch211-285c6.4
0.108
wdr74
-0.028
LOC100330084
0.106
tcf7l2
-0.028
LOC101882124
0.105
elovl6
-0.027
si:ch211-260e23.8
0.104
si:dkey-154p10.3
-0.027
kcnk5a
0.103
mid2
-0.027
si:ch211-255i20.3
0.099
pmela
-0.027
LOC110438016
0.098
ilkap
-0.026
slc30a2
0.097
dna2
-0.026
BX649516.1
0.094
gnl3l
-0.026
znf1116
0.093
nrbp2a
-0.025
gabra2a
0.091
zbtb43
-0.025
zgc:162608
0.091
lin28b
-0.025
cacna1fb
0.091
tnip1
-0.025
si:ch73-93k15.5
0.090
snrpd3
-0.025
LOC110440132
0.090
chrd
-0.025
or111-10
0.090
meox1
-0.025
ftr87
0.089
otx1
-0.025
BX957346.3
0.089
phc1
-0.025
si:ch73-139e5.4
0.089
si:dkey-108k21.21
-0.025
CABZ01080074.1
0.088
alg2
-0.025
dram2a
0.088
lmo7b
-0.025
nlgn4xa
0.087
ndr2
-0.025
CU074330.1
0.087
galnt16
-0.025