Daniocell
rhbdd2 (ionocytes / mucous-producing)
rhomboid domain containing 2
ZFIN
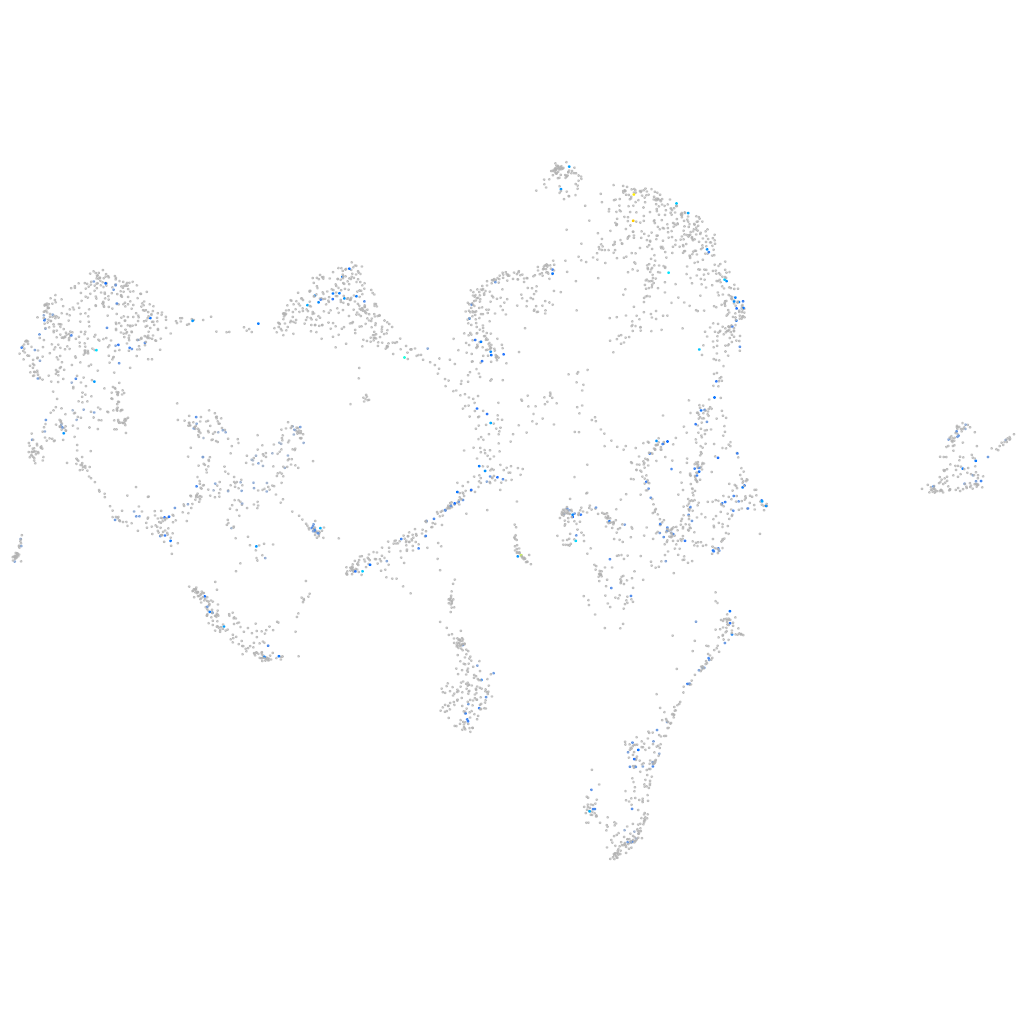
Gene expression UMAP
Display:
Expression
Stage
Other cell groups
all cells
blastomeres
PGCs
endoderm
axial mesoderm
muscle
mural cells /
non-skeletal muscle
mesenchyme
hematopoietic /
vasculature
pronephros
neural
spinal cord / glia
eye
taste / olfactory
otic / lateral line
epidermis
periderm
fin
ionocytes / mucous
pigment cells
Expression by stage/cluster
Correlated gene expression
Positive correlation
Negative correlation
Gene
r
Gene
r
slc6a19a.1
0.197
myhz1.1
-0.054
si:ch211-125m10.6
0.189
ttn.1
-0.045
CU466278.1
0.169
mt-atp8
-0.040
si:ch73-29c22.1
0.151
icn2
-0.039
lenep
0.150
si:dkeyp-86h10.3
-0.038
XLOC-014490
0.142
MYO1D
-0.038
cfh
0.140
si:ch73-184c24.1
-0.037
klhl14
0.135
aco1
-0.036
NPFFR2
0.134
eevs
-0.036
lratb.2
0.134
wu:fi37e09
-0.036
LOC108182317
0.127
spg11
-0.036
CR855311.2
0.126
cabp1a
-0.036
CABZ01018269.1
0.123
cnot6l
-0.035
si:ch211-229d2.5
0.123
lrfn4b
-0.035
dennd4b
0.123
elmsan1a
-0.035
LOC110440168
0.119
map3k21
-0.034
mctp1a
0.116
mt-nd4l
-0.034
unc5a
0.113
gapdh
-0.034
gpr78a
0.111
ppip5k2
-0.034
cobl
0.110
rbms1b
-0.034
slc2a2
0.109
si:ch211-160j14.2
-0.033
slc16a2
0.109
LOC100149234
-0.033
BX927317.2
0.107
mylz3
-0.033
taar11
0.106
XLOC-024231
-0.033
dnajc16
0.106
ndrg1a
-0.033
aqp9b
0.104
uacaa
-0.033
zbtb25
0.104
brpf3a
-0.033
NC-002333.2
0.104
si:dkey-193p11.2
-0.033
dolk
0.103
cadps2
-0.033
LO018166.1
0.102
hbae1.3
-0.033
pcdh1gc5
0.100
ldb3a
-0.032
lrrc4.2
0.100
hbbe2
-0.032
tm4sf5
0.099
si:dkey-7c18.24
-0.032
CU467110.1
0.096
SLC9B2
-0.032
spata5l1
0.095
si:ch211-157b11.12
-0.032