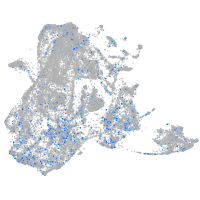
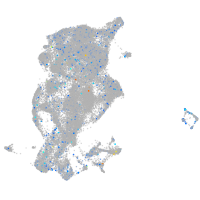
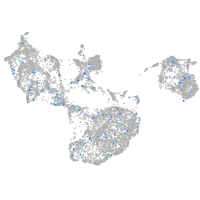
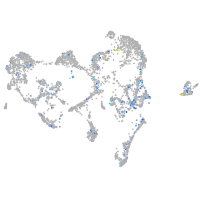
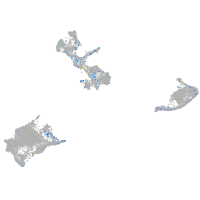
GA binding protein transcription factor subunit beta 2a
ZFIN 
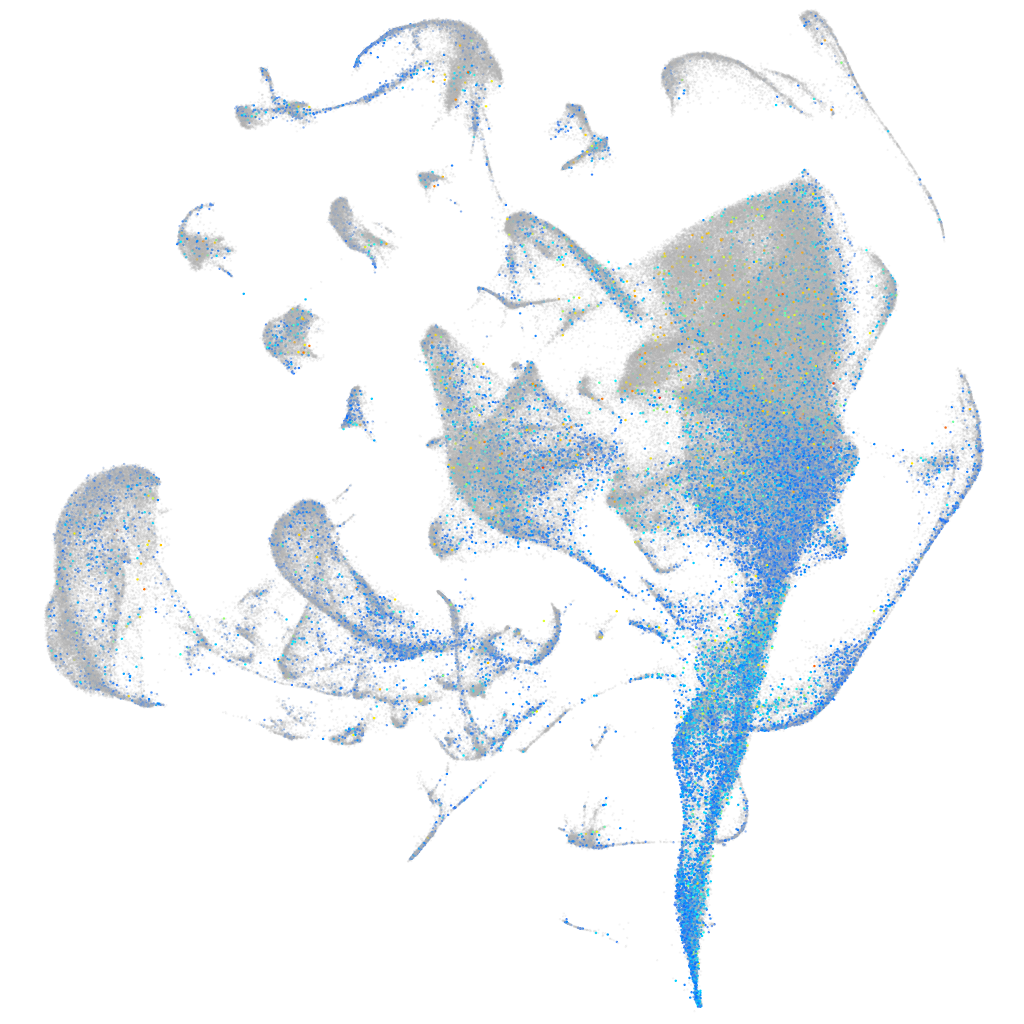
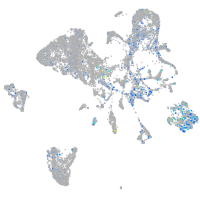
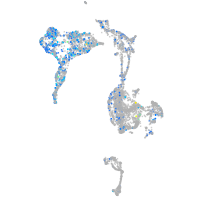
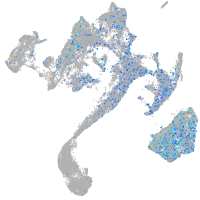
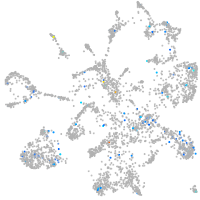
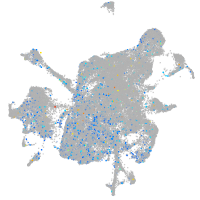
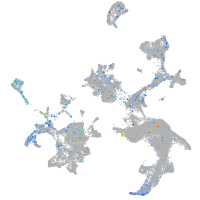
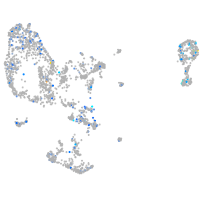
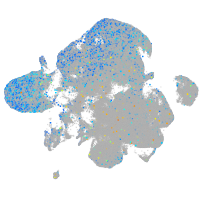
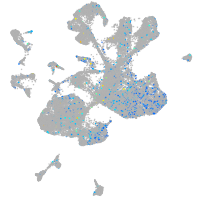
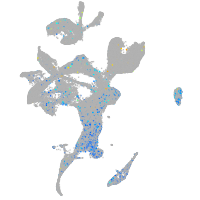
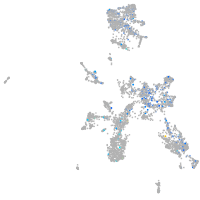
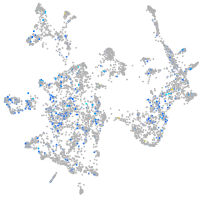
Expression by stage/cluster


Correlated gene expression


| Positive correlation | Negative correlation | ||
| Gene | r | Gene | r |
| nop58 | 0.166 | pvalb1 | -0.074 |
| dkc1 | 0.165 | pvalb2 | -0.071 |
| fbl | 0.160 | krt4 | -0.068 |
| npm1a | 0.160 | cyt1 | -0.067 |
| ncl | 0.154 | actc1b | -0.065 |
| nop56 | 0.154 | ccni | -0.063 |
| hnrnpa1b | 0.147 | calm1a | -0.060 |
| snu13b | 0.146 | cyt1l | -0.059 |
| hspb1 | 0.144 | hbbe1.3 | -0.059 |
| lig1 | 0.144 | rtn1a | -0.059 |
| anp32b | 0.143 | icn | -0.058 |
| banf1 | 0.142 | stmn1b | -0.057 |
| ppig | 0.141 | anxa1a | -0.056 |
| mki67 | 0.140 | gapdhs | -0.056 |
| nhp2 | 0.140 | hbae3 | -0.056 |
| pou5f3 | 0.139 | krtt1c19e | -0.056 |
| bms1 | 0.138 | rnasekb | -0.056 |
| chaf1a | 0.138 | atp6v0cb | -0.055 |
| gar1 | 0.138 | tob1b | -0.055 |
| nop2 | 0.138 | ckbb | -0.054 |
| ppm1g | 0.137 | gng3 | -0.054 |
| s100a1 | 0.137 | atp6v1e1b | -0.053 |
| snrpb | 0.137 | gpm6ab | -0.053 |
| polr3gla | 0.135 | krt5 | -0.053 |
| pprc1 | 0.135 | s100a10b | -0.053 |
| zgc:56699 | 0.135 | icn2 | -0.052 |
| cx43.4 | 0.134 | si:ch211-195b11.3 | -0.052 |
| ddx18 | 0.133 | sncb | -0.052 |
| ebna1bp2 | 0.132 | tmsb1 | -0.052 |
| mphosph10 | 0.132 | atp5if1b | -0.051 |
| stm | 0.132 | atp6v1g1 | -0.051 |
| nolc1 | 0.131 | gabarapl2 | -0.051 |
| seta | 0.131 | gpm6aa | -0.051 |
| si:ch211-152c2.3 | 0.131 | mylpfa | -0.051 |
| srsf1a | 0.131 | hbae1.1 | -0.050 |


