Daniocell
gabpb2a (taste / olfactory)
GA binding protein transcription factor subunit beta 2a
ZFIN
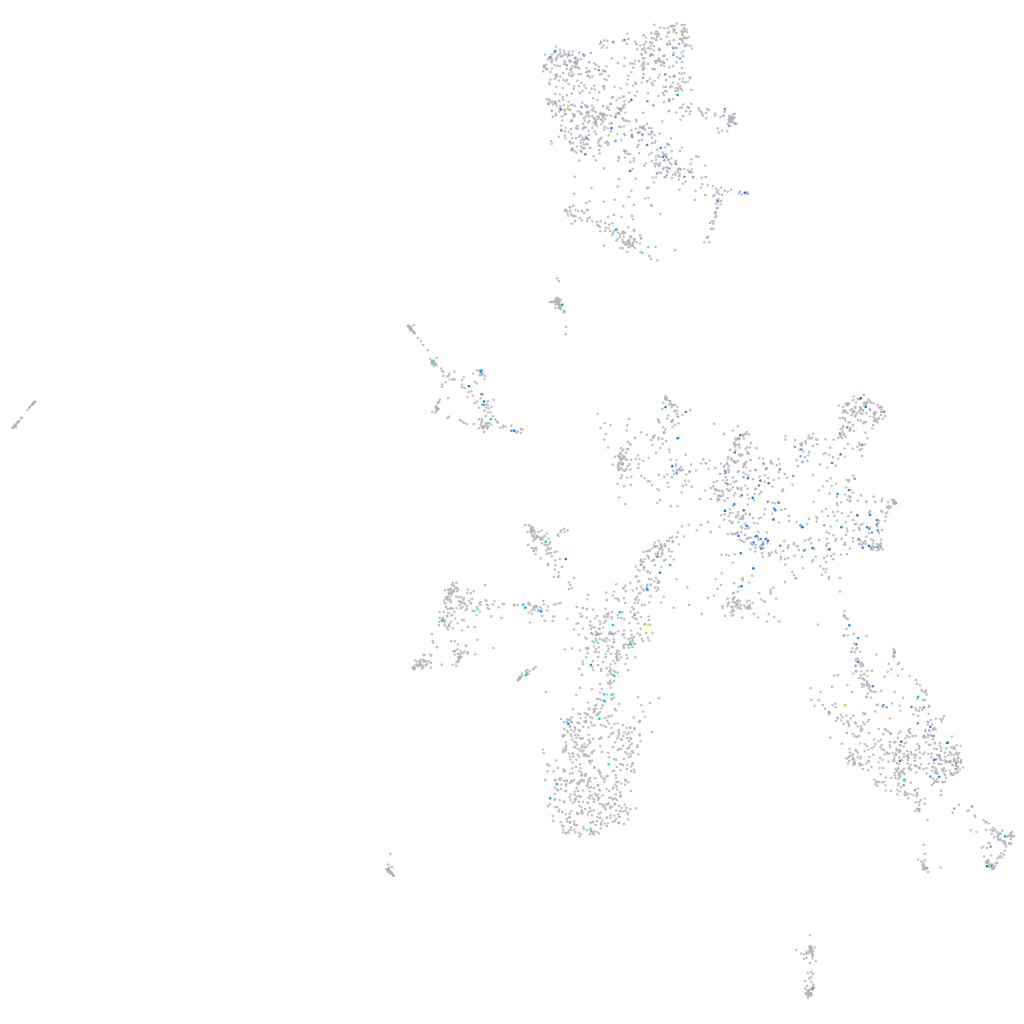
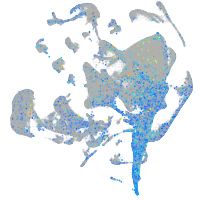
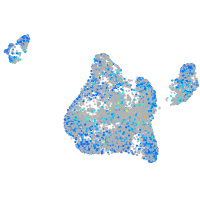
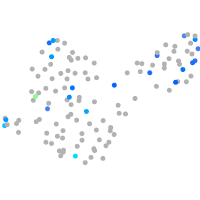
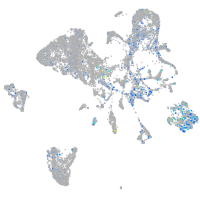
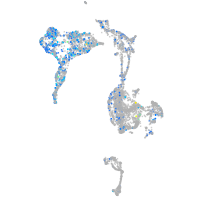
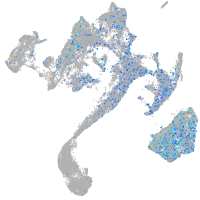
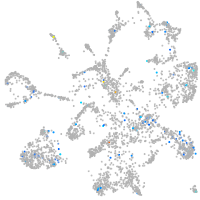
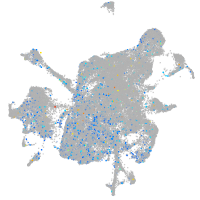
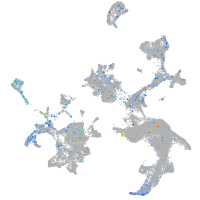
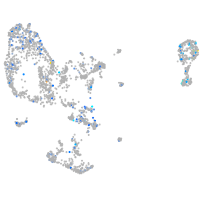
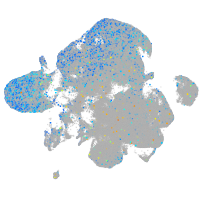
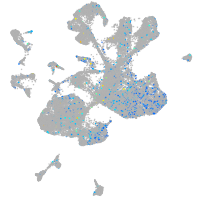
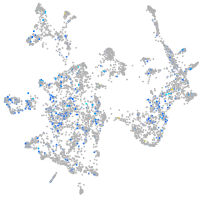
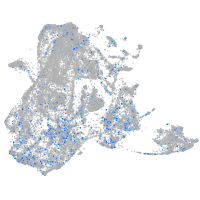
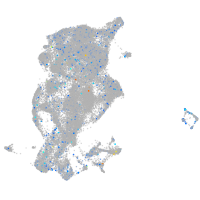
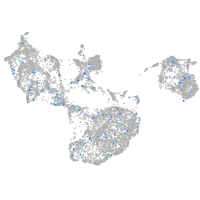
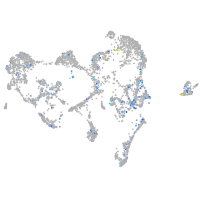
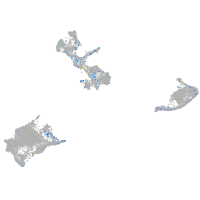
Gene expression UMAP
Display:
Expression
Stage
Other cell groups
all cells
blastomeres
PGCs
endoderm
axial mesoderm
muscle
mural cells /
non-skeletal muscle
mesenchyme
hematopoietic /
vasculature
pronephros
neural
spinal cord / glia
eye
taste / olfactory
otic / lateral line
epidermis
periderm
fin
ionocytes / mucous
pigment cells
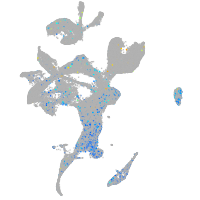
Expression by stage/cluster
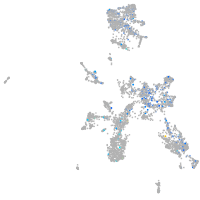
Correlated gene expression
Positive correlation
Negative correlation
Gene
r
Gene
r
znf1103
0.192
htatip2
-0.062
zgc:110410
0.180
abcc5
-0.056
CU041319.1
0.159
nrsn1
-0.056
tnfaip2b
0.157
si:dkey-71b5.7
-0.055
XLOC-042938
0.156
TSTD1
-0.055
LO018490.1
0.136
soul2
-0.054
crygm2d2
0.135
selenow2b
-0.054
nptx2b
0.135
tescb
-0.054
LOC101886244
0.135
nrn1la
-0.053
LOC110437982
0.134
adcyap1b
-0.053
si:ch211-160b11.4
0.133
fstl5
-0.052
CR450738.1
0.131
pir
-0.052
tmprss12
0.129
txn
-0.052
fam120a
0.124
si:rp71-17i16.6
-0.052
fbxo43
0.124
nupr1a
-0.052
slc24a1
0.124
pvalb1
-0.051
LOC110438269
0.120
pvalb2
-0.050
cx31.7
0.120
ppdpfb
-0.050
si:ch211-261n11.8
0.117
fabp10b
-0.050
LOC100535506
0.117
stx2b
-0.050
plxnd1
0.117
rnf115
-0.050
CR626874.1
0.116
snap25b
-0.050
LOC101882892
0.116
mapk10
-0.049
XLOC-042234
0.115
adam23a
-0.049
BX936284.1
0.112
gstp1
-0.048
BX510301.2
0.112
pacsin1a
-0.048
LOC103909787
0.111
map1aa
-0.048
XLOC-030940
0.110
jph3
-0.048
nop58
0.110
prss1
-0.048
dkc1
0.109
gpx4a
-0.047
ssrp1a
0.107
CR383676.1
-0.047
CU657976.1
0.107
actc1b
-0.047
olfch1
0.107
strbp
-0.046
bccip
0.107
LOC103911065
-0.046
sdsl
0.106
glula
-0.046