Daniocell
rc3h1a (fin)
ring finger and CCCH-type domains 1a
ZFIN
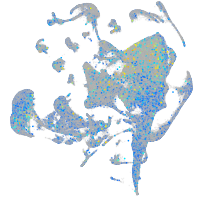
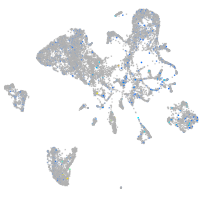
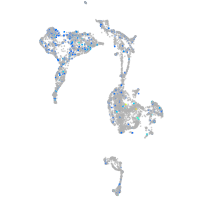
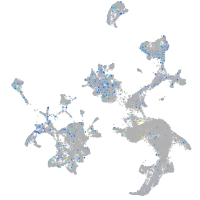
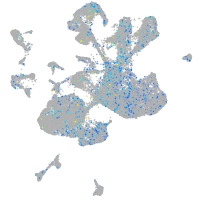
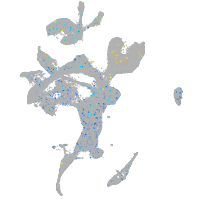
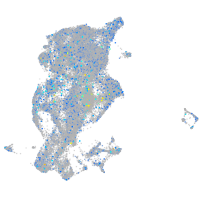
Gene expression UMAP
Display:
Expression
Stage
Other cell groups
all cells
blastomeres
PGCs
endoderm
axial mesoderm
muscle
mural cells /
non-skeletal muscle
mesenchyme
hematopoietic /
vasculature
pronephros
neural
spinal cord / glia
eye
taste / olfactory
otic / lateral line
epidermis
periderm
fin
ionocytes / mucous
pigment cells
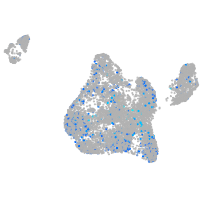
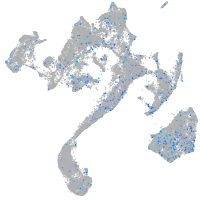
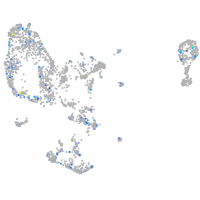
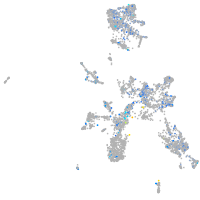
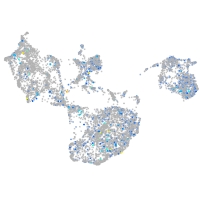
Expression by stage/cluster
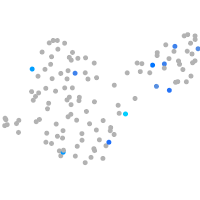
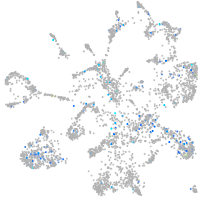
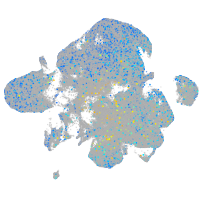
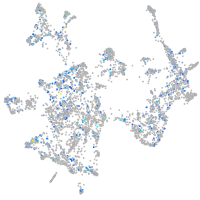
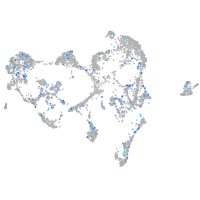
Correlated gene expression
Positive correlation
Negative correlation
Gene
r
Gene
r
LOC101884169
0.124
rpl39
-0.057
XLOC-031737
0.122
ttc36
-0.054
RF00069
0.122
rps24
-0.053
XLOC-042668
0.116
bhmt
-0.052
XLOC-041558
0.116
si:dkey-151g10.6
-0.050
abcg2b
0.116
rplp2l
-0.050
rnaset2l
0.114
CABZ01092746.1
-0.048
si:ch211-156p11.1
0.113
rps12
-0.047
LOC103911992
0.113
rpl10a
-0.047
si:ch73-62b13.1
0.109
LOC100535130
-0.047
XLOC-003053
0.106
rpl8
-0.047
pnrc2
0.102
fkbp7
-0.047
BX248521.2
0.092
rplp1
-0.047
LOC103909967
0.091
actc1b
-0.047
klhl40b
0.091
faua
-0.047
xkr5a
0.091
ecrg4a
-0.046
znf541
0.090
zgc:153675
-0.044
CABZ01059627.3
0.090
hpdb
-0.044
LOC108182766
0.089
rps20
-0.043
cacna1fa
0.088
hgd
-0.042
GMEB2
0.088
pcbd1
-0.041
si:ch211-132p1.3
0.085
eve1
-0.041
zmp:0000001082
0.084
fbln1
-0.040
tmem267
0.084
prdx4
-0.040
si:dkey-285b23.4
0.084
c1qtnf5
-0.040
midn
0.083
rpl27a
-0.040
en2a
0.083
hoxa13a
-0.040
CR936462.1
0.083
ppib
-0.039
CU855948.1
0.083
ttn.1
-0.039
runx1
0.082
fkbp14
-0.039
ccng2
0.082
rps26
-0.039
qsox1
0.082
hoxa13b
-0.039
lim2.3
0.082
prrx1b
-0.039
si:zfos-128g4.1
0.081
mfap2
-0.039
cast
0.081
rpl29
-0.038