Daniocell
nav2a (periderm)
neuron navigator 2a
ZFIN
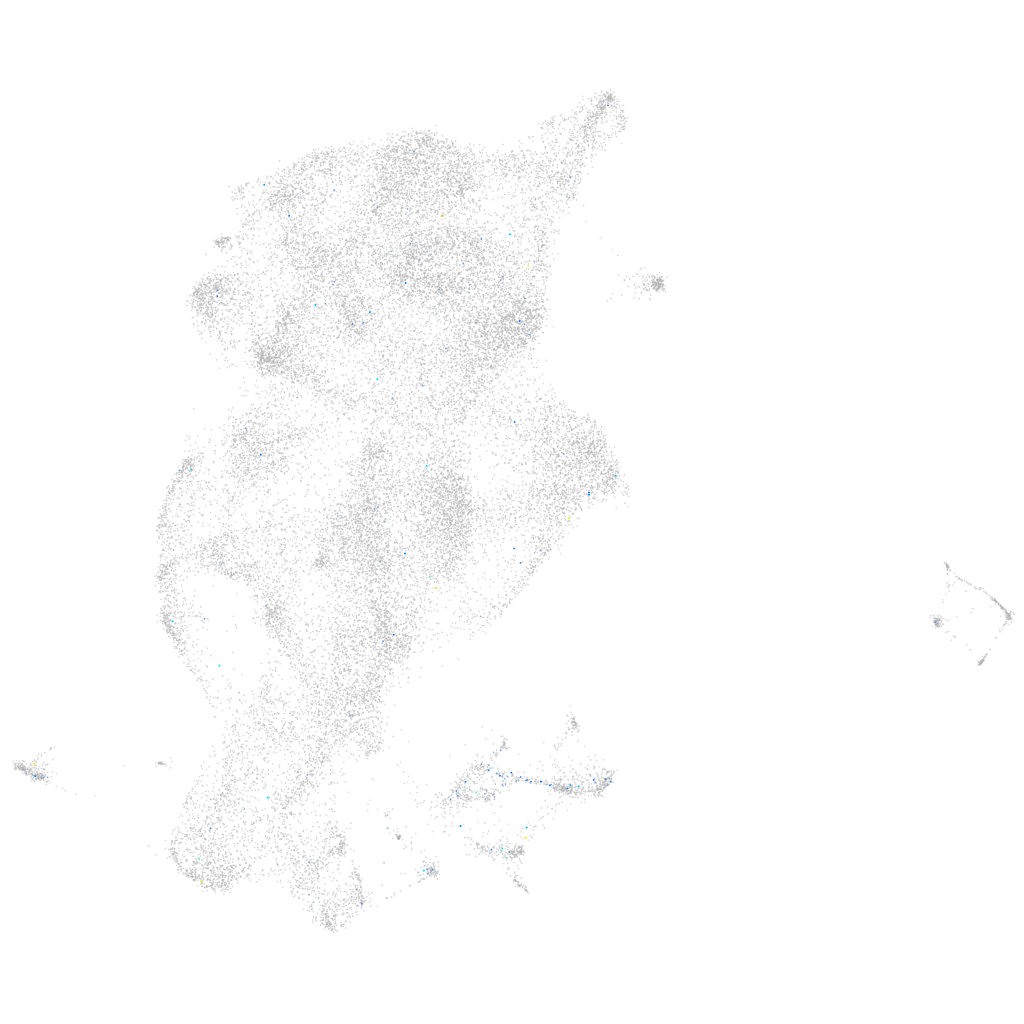
Gene expression UMAP
Display:
Expression
Stage
Other cell groups
all cells
blastomeres
PGCs
endoderm
axial mesoderm
muscle
mural cells /
non-skeletal muscle
mesenchyme
hematopoietic /
vasculature
pronephros
neural
spinal cord / glia
eye
taste / olfactory
otic / lateral line
epidermis
periderm
fin
ionocytes / mucous
pigment cells
Expression by stage/cluster
Correlated gene expression
Positive correlation
Negative correlation
Gene
r
Gene
r
LOC103910250
0.213
cyt1
-0.046
LOC103910690
0.200
krt4
-0.043
CR812468.1
0.199
krt5
-0.038
LOC103909000
0.152
si:ch211-195b11.3
-0.037
XLOC-009823
0.150
zgc:193505
-0.036
fbxo40.2
0.147
wu:fb18f06
-0.031
styxl1
0.134
cyt1l
-0.031
runx2a
0.129
zgc:175088
-0.029
si:ch73-199e17.1
0.128
krtt1c19e
-0.028
mylk3
0.125
si:ch73-52f15.5
-0.028
LOC110438203
0.124
aldob
-0.028
c3a.4
0.119
aldh9a1a.1
-0.026
invs
0.115
ckap4
-0.026
zgc:173693
0.113
cebpd
-0.024
ccl19b
0.113
si:dkey-184p9.7
-0.023
grnas
0.113
mid1ip1a
-0.023
nuggc.1
0.110
si:ch211-105c13.3
-0.023
upp2
0.110
abcb5
-0.023
si:dkey-1c7.1
0.109
them6
-0.022
AL845419.1
0.109
fxyd6l
-0.022
cbln8
0.104
cfl1l
-0.022
si:dkey-32e23.4
0.101
cmah
-0.021
zgc:193726
0.101
si:dkey-16p21.8
-0.021
si:dkey-208c12.2
0.101
krt17
-0.021
BX248390.1
0.100
si:ch211-157c3.4
-0.020
prss23
0.099
icn2
-0.020
LOC110439844
0.099
rpl10
-0.020
XLOC-042595
0.096
anxa1c
-0.020
prelp
0.095
si:ch211-125o16.4
-0.020
NCEH1 (1 of many)
0.094
cav2
-0.020
LOC100331639
0.094
si:dkeyp-1h4.6
-0.020
agrp
0.092
jupa
-0.020
LOC100005584
0.090
glo1
-0.020
rnf223
0.089
actb2
-0.019
si:ch211-157b11.8
0.088
agr1
-0.019