Daniocell
nav2a (otic / lateral line)
neuron navigator 2a
ZFIN
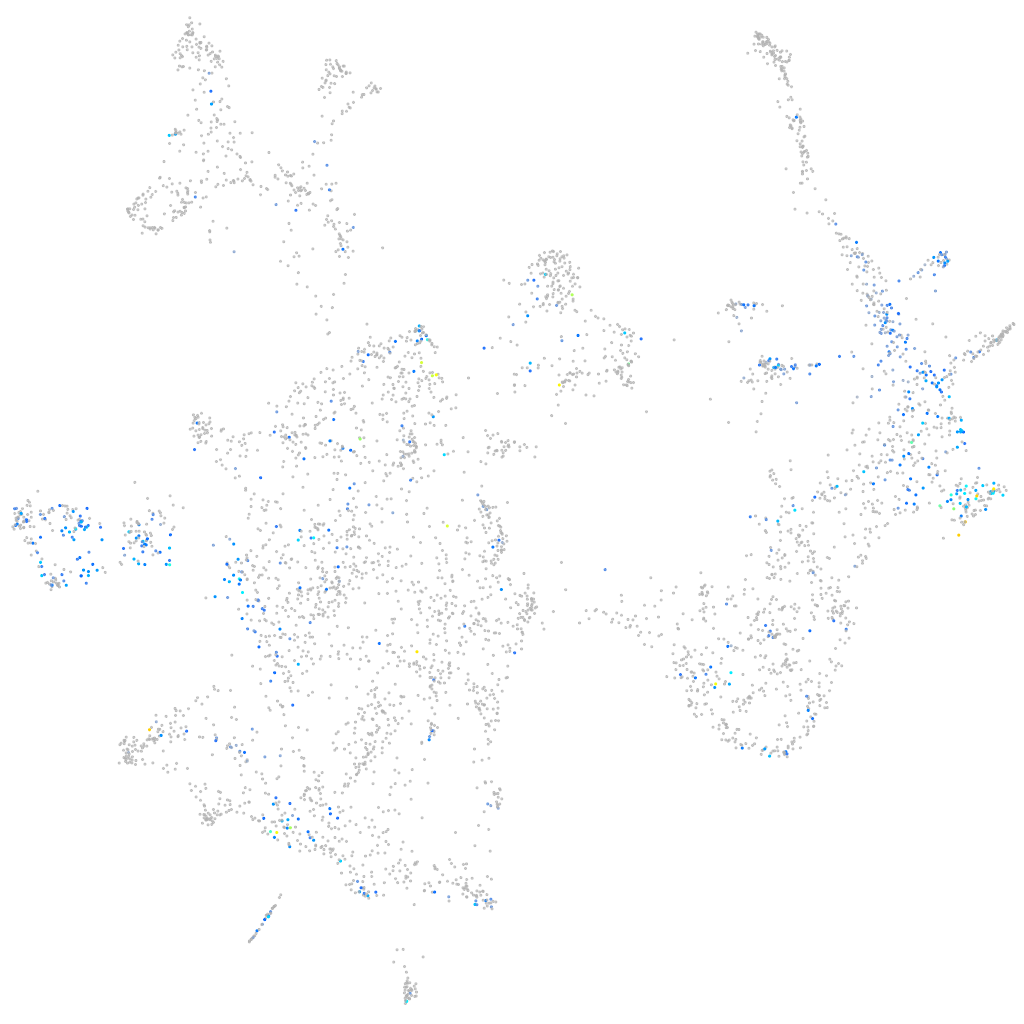
Gene expression UMAP
Display:
Expression
Stage
Other cell groups
all cells
blastomeres
PGCs
endoderm
axial mesoderm
muscle
mural cells /
non-skeletal muscle
mesenchyme
hematopoietic /
vasculature
pronephros
neural
spinal cord / glia
eye
taste / olfactory
otic / lateral line
epidermis
periderm
fin
ionocytes / mucous
pigment cells
Expression by stage/cluster
Correlated gene expression
Positive correlation
Negative correlation
Gene
r
Gene
r
tspan1
0.272
mt-co2
-0.090
hopx
0.256
serpine2
-0.085
si:dkey-103g5.3
0.250
lrrc73
-0.084
zgc:154054
0.238
atp1a3b
-0.084
tmem176l.4
0.235
atp2b1a
-0.084
net1
0.227
COX3
-0.084
gbgt1l3
0.223
si:ch73-15n15.3
-0.083
pkhd1l1
0.221
gpx2
-0.081
gmds
0.213
cd164l2
-0.081
wu:fj16a03
0.213
tmc2a
-0.081
negaly6
0.212
col9a2
-0.080
si:ch73-335l21.4
0.212
CR925719.1
-0.080
ponzr6
0.201
col9a1a
-0.079
cldnh
0.200
si:ch211-80h18.1
-0.079
spock2
0.196
bdnf
-0.078
si:ch211-103f14.3
0.195
aldocb
-0.077
cts12
0.193
gb:eh456644
-0.077
copz2
0.192
dnajc5b
-0.076
wu:fc01d11
0.191
pou4f3
-0.076
fam20cb
0.191
osbpl1a
-0.075
klf2a
0.190
tmprss3a
-0.075
krt1-c5
0.188
otofb
-0.075
zgc:153317
0.188
nptna
-0.074
cldn7b
0.188
atp1b2b
-0.074
soul2
0.186
calml4a
-0.074
tmem176l.3b
0.185
rps29
-0.073
elf3
0.183
emb
-0.073
spaca4l
0.181
vdac3
-0.073
dnase1l4.1
0.181
otomp
-0.073
cavin2b
0.180
vamp2
-0.072
si:dkey-205h13.2
0.179
cox6b1
-0.072
si:ch211-98n17.5
0.179
s100s
-0.072
fat2
0.176
si:ch211-226m7.4
-0.072
zgc:158343
0.175
si:dkeyp-46h3.1
-0.072
ablim2
0.174
tpi1a
-0.072