Daniocell
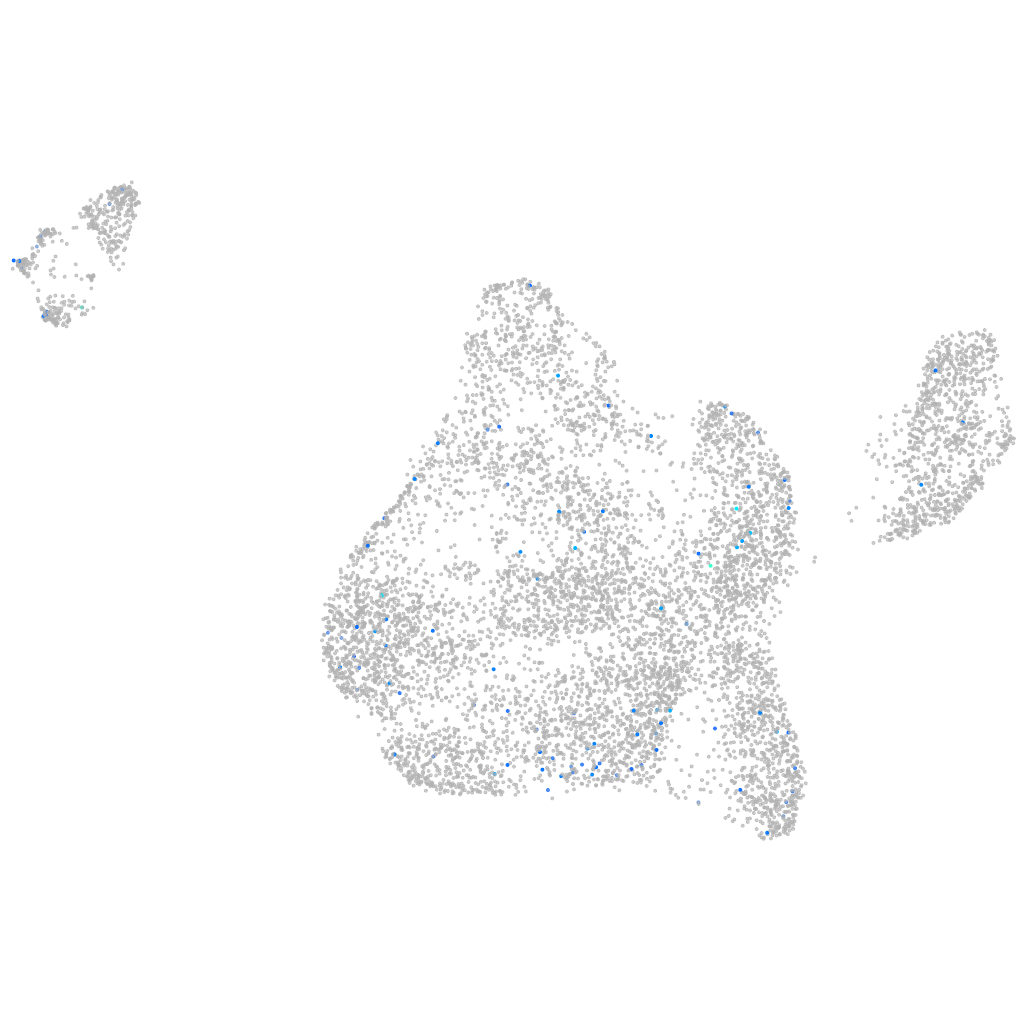
nav2a (blastomeres)
neuron navigator 2a
ZFIN
Gene expression UMAP
Display:
Expression
Stage
Other cell groups
all cells
blastomeres
PGCs
endoderm
axial mesoderm
muscle
mural cells /
non-skeletal muscle
mesenchyme
hematopoietic /
vasculature
pronephros
neural
spinal cord / glia
eye
taste / olfactory
otic / lateral line
epidermis
periderm
fin
ionocytes / mucous
pigment cells
Expression by stage/cluster
Correlated gene expression
Positive correlation
Negative correlation
Gene
r
Gene
r
LOC101883855
0.187
phf14
-0.035
FP102309.1
0.159
wu:fb97g03
-0.029
nampta
0.150
gtf2a1
-0.029
trim66
0.138
cdkn2aipnl
-0.027
CABZ01065417.1
0.138
mrps16
-0.026
CABZ01061498.1
0.131
fthl27
-0.026
thpo
0.122
smim12
-0.026
ldlrad4a
0.118
higd1a
-0.026
v2rc1
0.115
ndufc2
-0.025
CT573163.1
0.110
aplnra
-0.025
tmtops3a
0.109
rab3gap2
-0.025
LOC110439728
0.109
prpsap2
-0.024
LOC103908992
0.108
aktip
-0.024
LOC103909568
0.108
tob1a
-0.024
nitr11a
0.106
mapre1b
-0.024
CR318588.1
0.106
dynlrb1
-0.024
CU329666.1
0.104
zgc:77849
-0.024
shbg
0.104
eri1
-0.024
pcyt1bb
0.101
pabpc1a
-0.024
BX663605.1
0.101
rdh10a
-0.024
si:dkey-226n24.1
0.100
cfl1
-0.023
ft2
0.100
bphl
-0.023
helq
0.099
trim35-40
-0.023
csf1ra
0.099
cnn2
-0.023
CU137680.1
0.099
si:dkey-67c22.2
-0.023
VASH1
0.098
fip1l1b
-0.023
tekt4
0.097
nhej1
-0.023
XLOC-043334
0.097
zgc:114119
-0.023
XLOC-039841
0.096
yap1
-0.023
si:dkey-183c2.4
0.094
wbp1
-0.023
nrros
0.094
znf1059
-0.022
CR352226.4
0.093
cnih1
-0.022
tiam2b
0.093
zgc:171435
-0.022
krt94
0.093
tmem59l
-0.022
cabp2a
0.093
ddx39aa
-0.022