
"membrane protein, palmitoylated 2a (MAGUK p55 subfamily member 2)"
ZFIN 
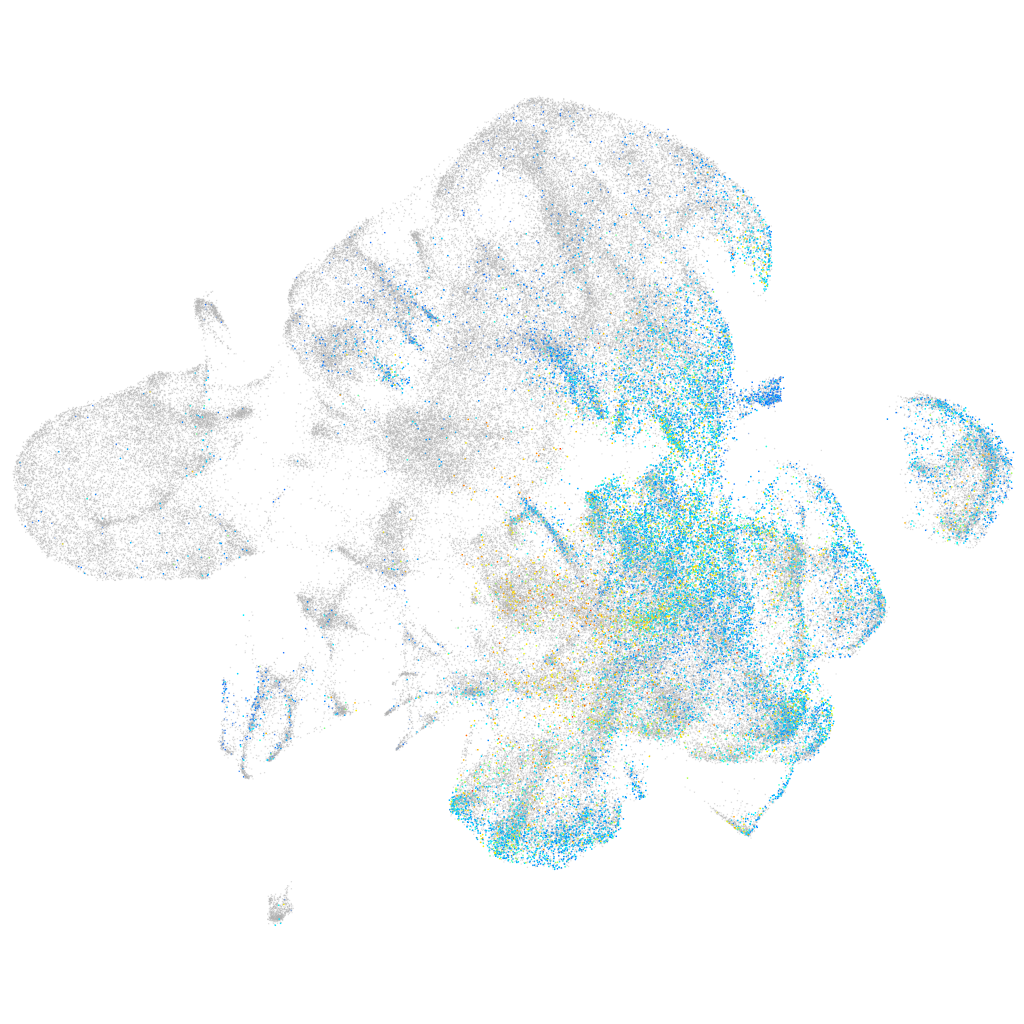
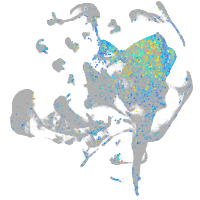
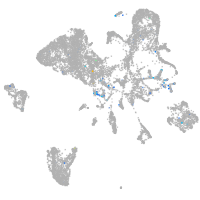
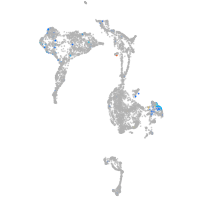
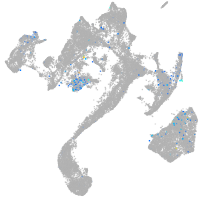
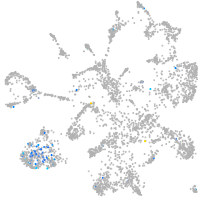
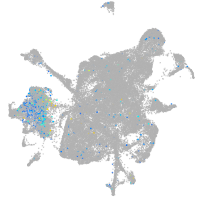
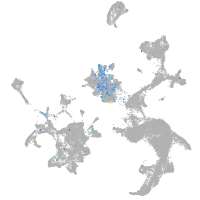
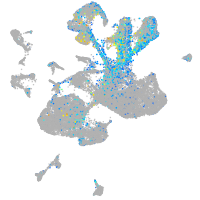
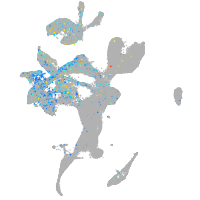
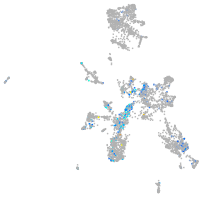
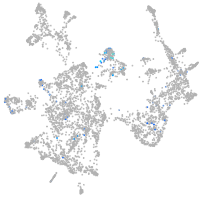
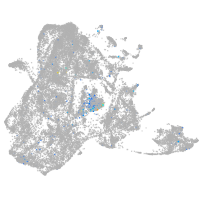
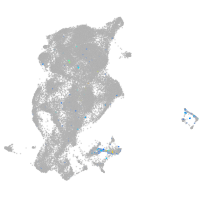
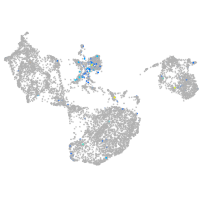
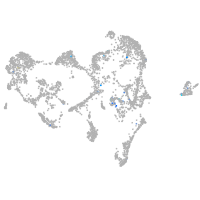
Gene expression UMAP


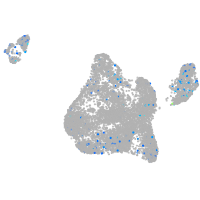
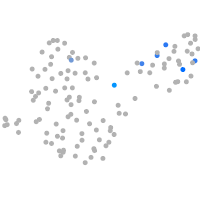


Expression by stage/cluster
Correlated gene expression
| Positive correlation | Negative correlation | ||
| Gene | r | Gene | r |
| elavl3 | 0.311 | id1 | -0.205 |
| myt1b | 0.279 | pcna | -0.203 |
| scrt1a | 0.267 | npm1a | -0.185 |
| nhlh2 | 0.255 | hmgb2a | -0.182 |
| scrt2 | 0.248 | anp32b | -0.181 |
| myt1a | 0.236 | nop58 | -0.178 |
| stmn1b | 0.236 | snu13b | -0.176 |
| nova2 | 0.235 | selenoh | -0.174 |
| gdf11 | 0.225 | ranbp1 | -0.172 |
| rtn1a | 0.222 | dkc1 | -0.171 |
| celf3a | 0.222 | ccnd1 | -0.170 |
| epb41a | 0.218 | chaf1a | -0.167 |
| tmeff1b | 0.216 | stmn1a | -0.166 |
| LOC100537384 | 0.216 | banf1 | -0.166 |
| hmgb3a | 0.215 | nop10 | -0.165 |
| chd4a | 0.211 | lig1 | -0.164 |
| stap2a | 0.209 | fen1 | -0.163 |
| ebf3a | 0.202 | rpa3 | -0.162 |
| ptmaa | 0.201 | nop56 | -0.162 |
| fez1 | 0.201 | fbl | -0.161 |
| adam22 | 0.200 | mcm6 | -0.161 |
| gng2 | 0.200 | nhp2 | -0.157 |
| atcaya | 0.199 | nasp | -0.156 |
| tuba1c | 0.199 | cdca7b | -0.155 |
| tmsb | 0.196 | rsl1d1 | -0.153 |
| pdlim5a | 0.195 | nutf2l | -0.153 |
| si:ch73-386h18.1 | 0.194 | cdca7a | -0.153 |
| cbfa2t3 | 0.194 | mcm3 | -0.153 |
| gpm6aa | 0.193 | mcm5 | -0.153 |
| ckbb | 0.192 | mcm2 | -0.152 |
| zswim5 | 0.192 | msna | -0.151 |
| ebf2 | 0.192 | rrm1 | -0.151 |
| sox11b | 0.189 | tuba8l4 | -0.150 |
| FO082781.1 | 0.188 | si:ch73-281n10.2 | -0.149 |
| ywhah | 0.187 | tuba8l | -0.149 |