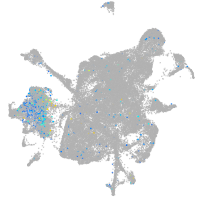
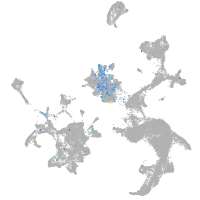
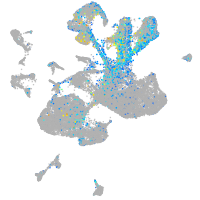
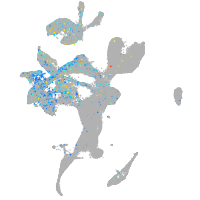
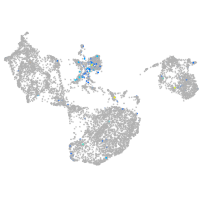
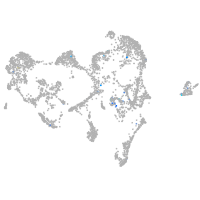
"membrane protein, palmitoylated 2a (MAGUK p55 subfamily member 2)"
ZFIN 
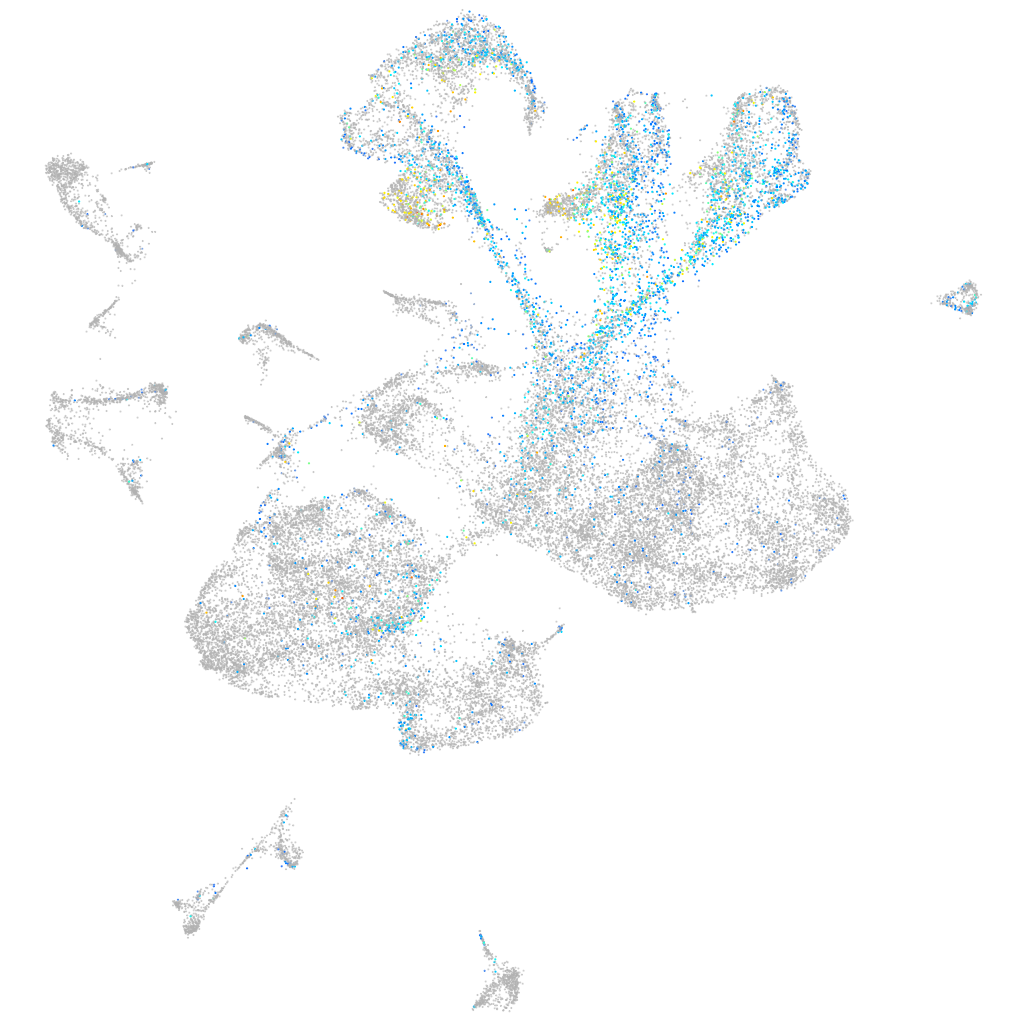
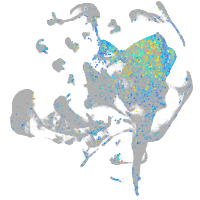
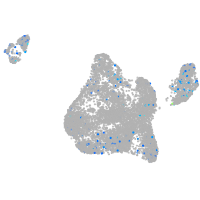
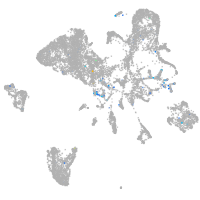
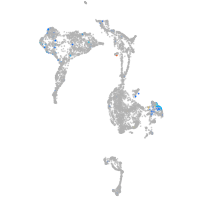
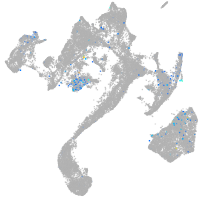
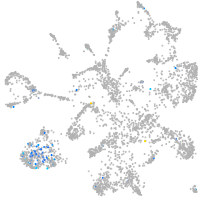
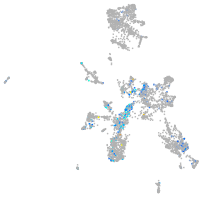
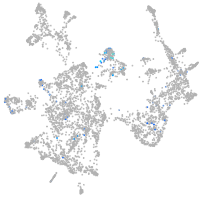
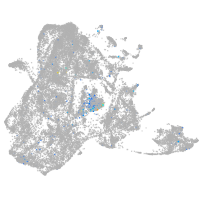
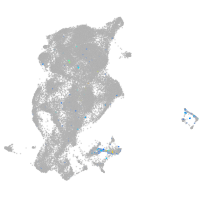
Expression by stage/cluster


Correlated gene expression


| Positive correlation | Negative correlation | ||
| Gene | r | Gene | r |
| elavl3 | 0.334 | id1 | -0.225 |
| myt1b | 0.331 | XLOC-003690 | -0.190 |
| scrt2 | 0.297 | cldn5a | -0.184 |
| scrt1a | 0.296 | fosab | -0.177 |
| nhlh2 | 0.291 | msna | -0.172 |
| LOC100537384 | 0.286 | vamp3 | -0.172 |
| stap2a | 0.272 | mdka | -0.170 |
| jagn1a | 0.262 | sdc4 | -0.168 |
| gng2 | 0.261 | sparc | -0.167 |
| epb41a | 0.260 | hmgb2a | -0.155 |
| zfhx3 | 0.259 | cd82a | -0.151 |
| stmn1b | 0.255 | sox3 | -0.151 |
| rtn1a | 0.253 | pcna | -0.150 |
| myt1a | 0.251 | atp1a1b | -0.149 |
| tmeff1b | 0.248 | si:ch73-281n10.2 | -0.149 |
| ebf3a | 0.247 | tuba8l4 | -0.148 |
| thsd7aa | 0.247 | COX7A2 (1 of many) | -0.147 |
| nsg2 | 0.244 | tuba8l | -0.147 |
| stxbp1a | 0.242 | selenoh | -0.145 |
| robo3 | 0.242 | msi1 | -0.145 |
| tmsb | 0.241 | fabp7a | -0.143 |
| gdf11 | 0.238 | dut | -0.141 |
| adam22 | 0.236 | notch3 | -0.140 |
| pik3r3b | 0.234 | cd63 | -0.139 |
| atcaya | 0.233 | ccng1 | -0.137 |
| si:ch73-386h18.1 | 0.232 | sox2 | -0.136 |
| celf3a | 0.230 | qki2 | -0.136 |
| pou2f2a | 0.229 | pgrmc1 | -0.135 |
| ube2ql1 | 0.229 | zfp36l1a | -0.135 |
| lhx1a | 0.228 | sox19a | -0.134 |
| uncx | 0.224 | ccnd1 | -0.134 |
| zc4h2 | 0.224 | zgc:56493 | -0.134 |
| vamp2 | 0.224 | si:ch73-265d7.2 | -0.133 |
| ywhah | 0.222 | her15.1 | -0.133 |
| stx1b | 0.222 | anp32b | -0.132 |


