Daniocell
mllt10 (axial mesoderm)
MLLT10 histone lysine methyltransferase DOT1L cofactor
ZFIN
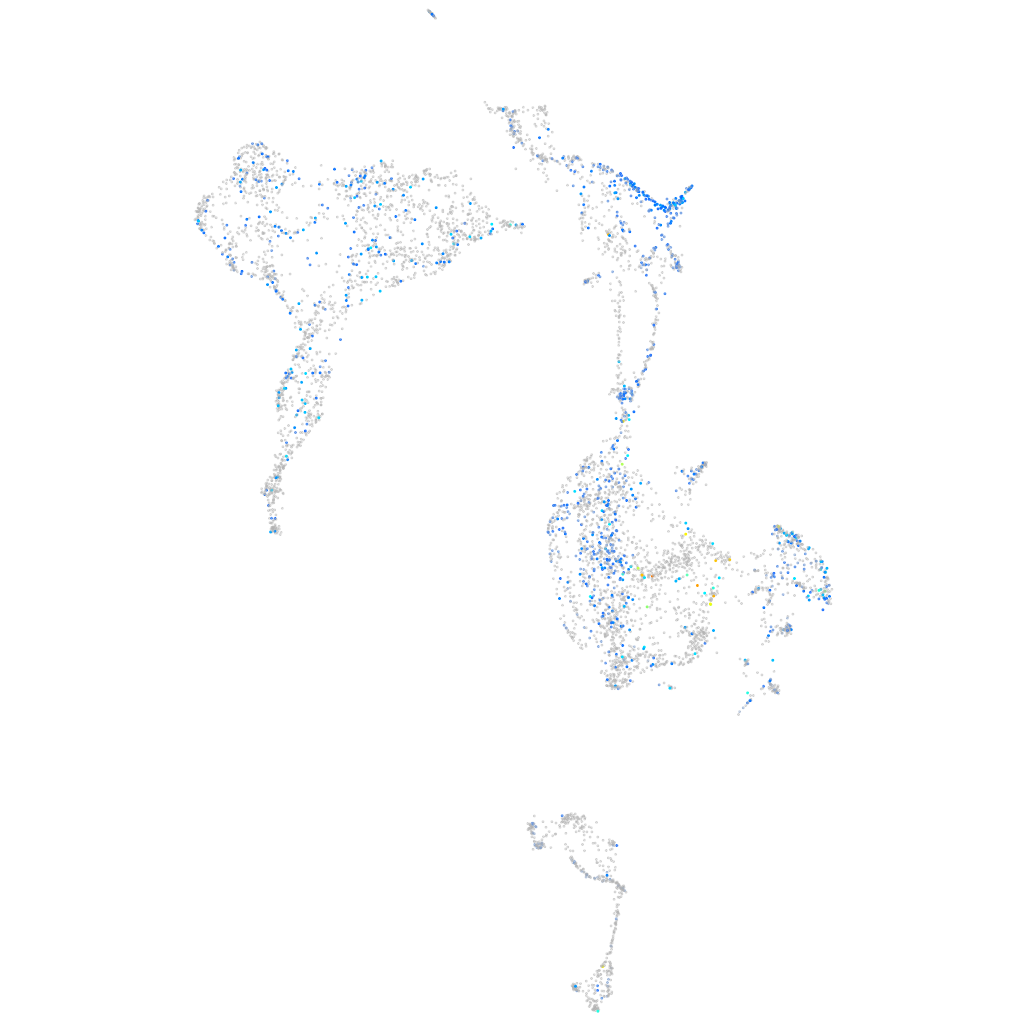
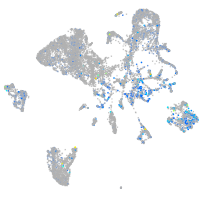
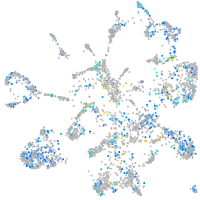
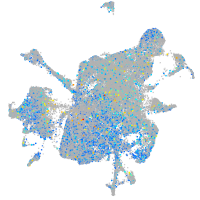
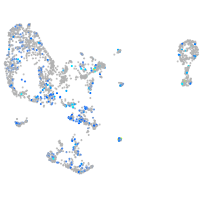
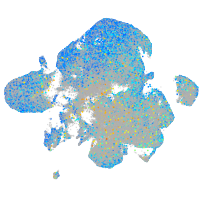
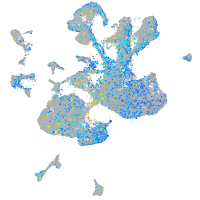
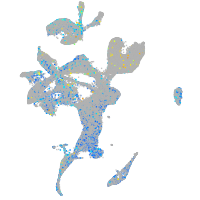
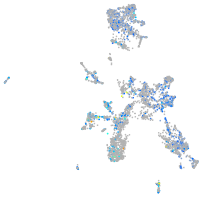
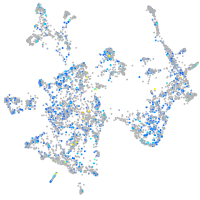
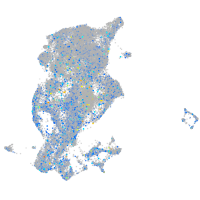
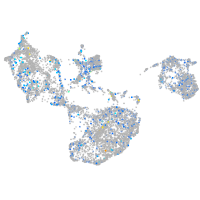
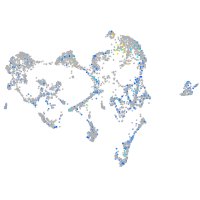
Gene expression UMAP
Display:
Expression
Stage
Other cell groups
all cells
blastomeres
PGCs
endoderm
axial mesoderm
muscle
mural cells /
non-skeletal muscle
mesenchyme
hematopoietic /
vasculature
pronephros
neural
spinal cord / glia
eye
taste / olfactory
otic / lateral line
epidermis
periderm
fin
ionocytes / mucous
pigment cells
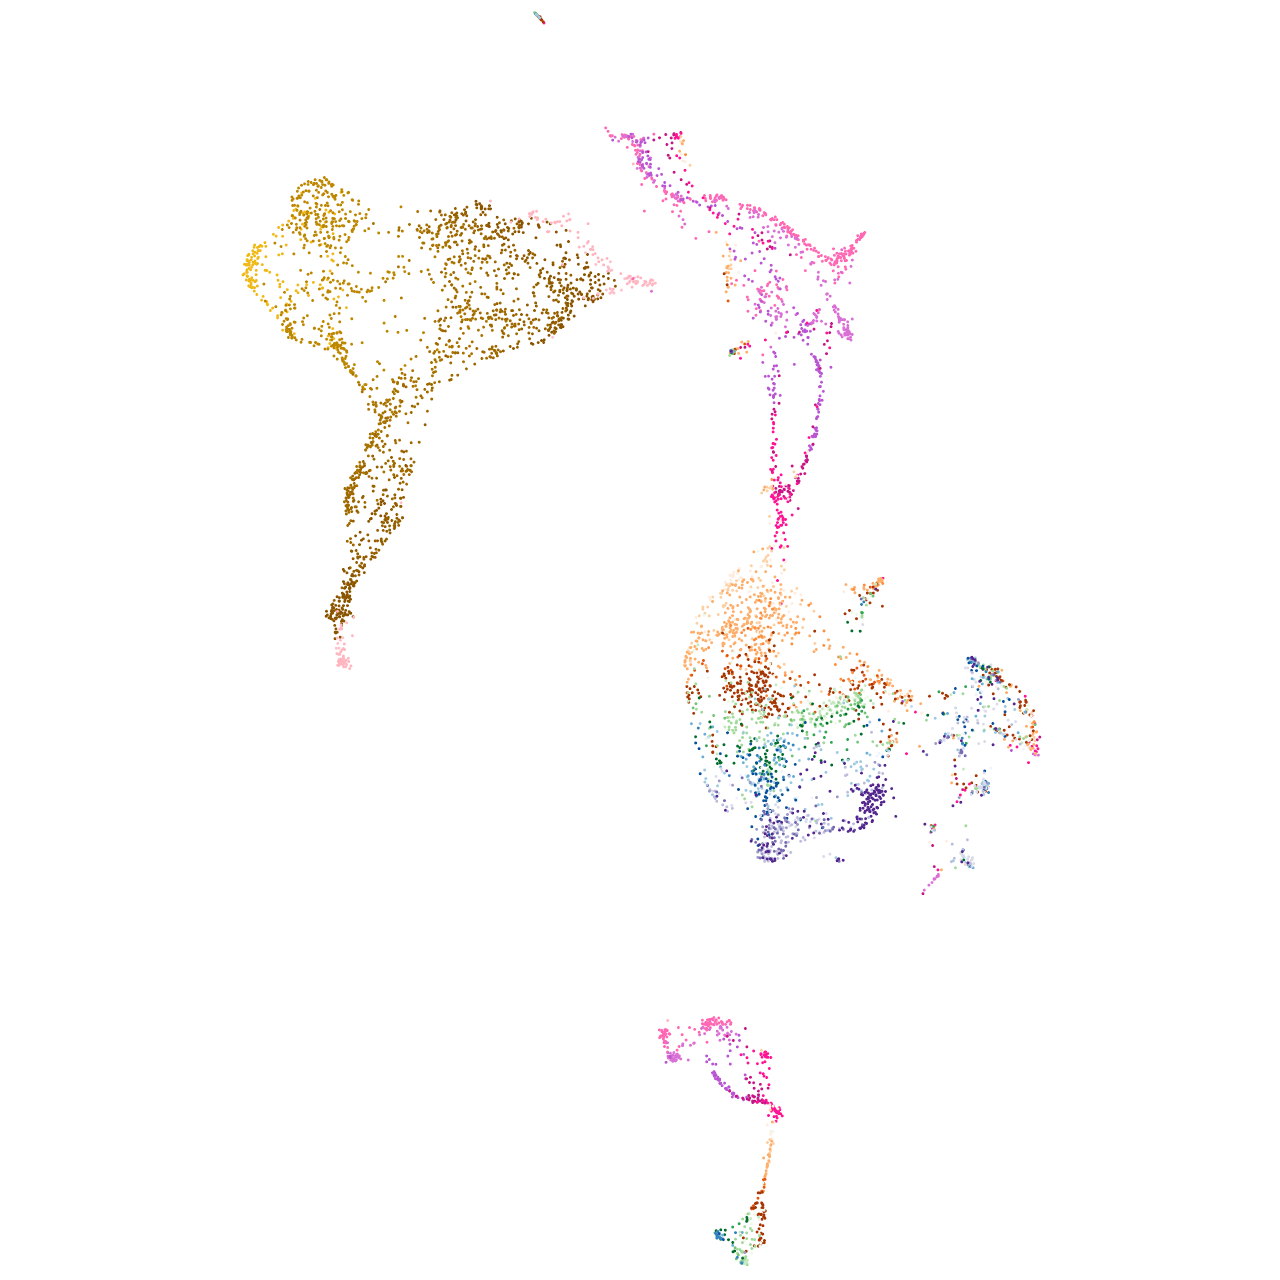
Expression by stage/cluster
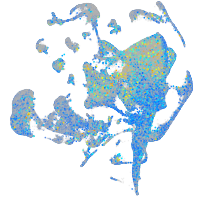
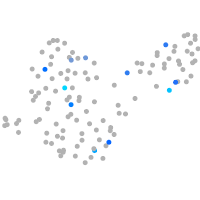
Correlated gene expression
Positive correlation
Negative correlation
Gene
r
Gene
r
agrn
0.176
ctslb
-0.080
chst2b
0.169
si:dkey-269i1.4
-0.079
tead1b
0.162
zgc:174153
-0.078
tbx3a
0.157
si:dkey-239j18.2
-0.077
tnfrsfa
0.156
si:dkey-151g10.6
-0.076
FQ323119.1
0.154
svopl
-0.076
metrnlb
0.154
spint2
-0.075
si:dkey-261h17.1
0.152
si:dkey-239j18.3
-0.075
irx3b
0.149
zgc:153284
-0.072
map1lc3cl
0.148
zgc:92380
-0.072
si:ch211-269k10.2
0.146
he1.2
-0.071
fkbp9
0.145
malb
-0.071
samd10a
0.145
si:dkey-26g8.5
-0.068
tbx3b
0.145
cldnh
-0.068
si:ch211-204c21.1
0.145
si:dkey-269i1.3
-0.067
tsc22d1
0.145
he1.1
-0.067
hdr
0.145
cldn7b
-0.066
inpp5b
0.144
s100v2
-0.065
id2a
0.143
cebpd
-0.065
sntb2
0.142
wu:fa26c03
-0.064
irx1b
0.142
pitx2
-0.063
tead3b
0.141
si:dkey-26g8.4
-0.063
nedd9
0.141
rcvrn2
-0.063
ARHGAP22 (1 of many)
0.139
stard10
-0.062
notch3
0.138
npm1a
-0.061
rgmb
0.138
arfgap3
-0.060
col5a3a
0.138
si:dkey-248g15.3
-0.060
si:dkey-65j6.2
0.136
timp4.1
-0.060
mfap2
0.135
tmprss9
-0.059
golgb1
0.135
lad1
-0.059
igdcc3
0.135
wu:fb18f06
-0.059
aff3
0.135
pbxip1b
-0.059
dock7
0.135
cd3eap
-0.058
caskin1
0.135
agr2
-0.057
kank1a
0.135
rnf183
-0.056