Daniocell
micu3a (muscle)
"mitochondrial calcium uptake family, member 3a"
ZFIN
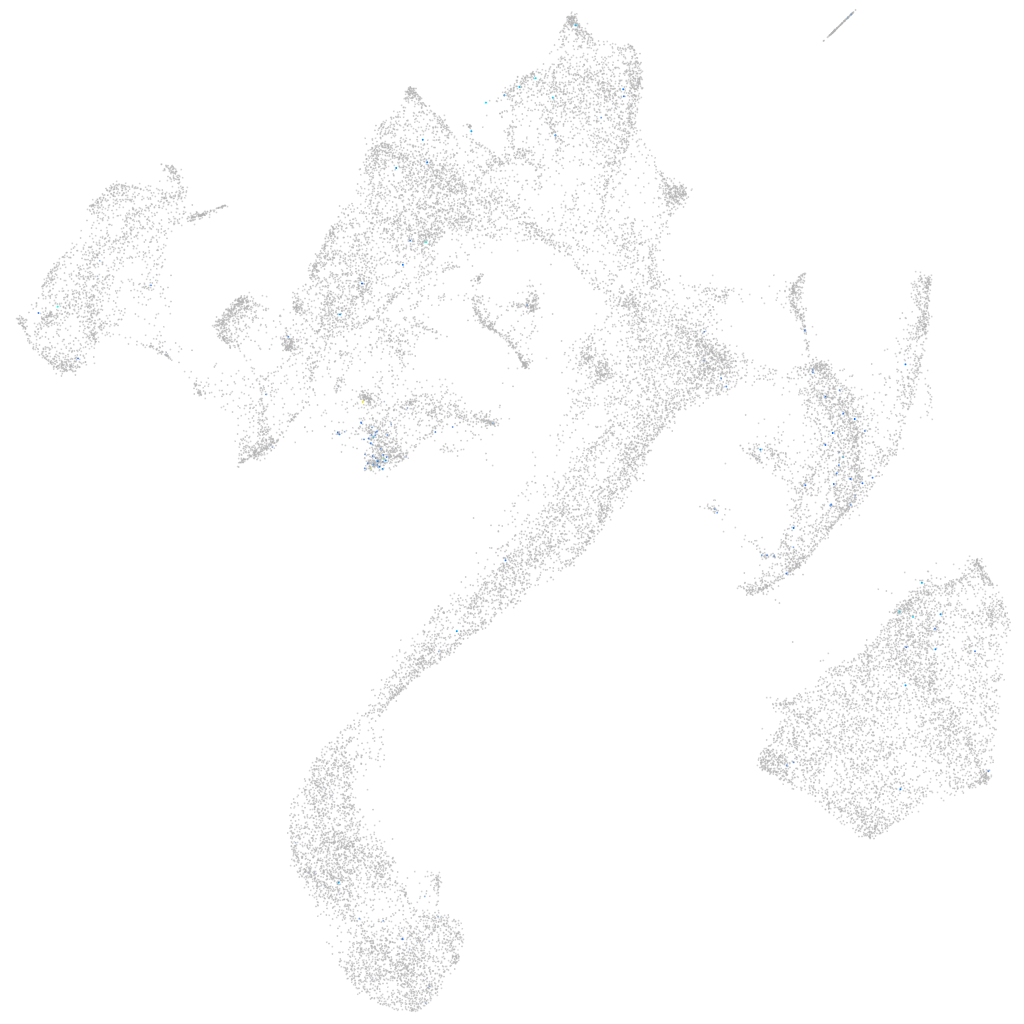
Gene expression UMAP
Display:
Expression
Stage
Other cell groups
all cells
blastomeres
PGCs
endoderm
axial mesoderm
muscle
mural cells /
non-skeletal muscle
mesenchyme
hematopoietic /
vasculature
pronephros
neural
spinal cord / glia
eye
taste / olfactory
otic / lateral line
epidermis
periderm
fin
ionocytes / mucous
pigment cells
Expression by stage/cluster
Correlated gene expression
Positive correlation
Negative correlation
Gene
r
Gene
r
LOC110439808
0.212
serbp1a
-0.032
rs1b
0.168
rpl4
-0.022
LOC108192008
0.155
rps12
-0.021
slc18a3b
0.150
eif4ebp3l
-0.019
grid1b
0.145
dusp27
-0.019
BEND4
0.133
rps20
-0.019
stxbp5l
0.126
mrpl35
-0.019
C1orf232
0.126
rpl32
-0.019
fam69ab
0.122
zgc:92429
-0.018
si:ch211-14i3.2
0.116
pdcd5
-0.018
evlb
0.116
rpl7a
-0.017
nxnl1
0.112
CABZ01072309.1
-0.017
bsk146
0.109
rbp7b
-0.017
tunar
0.107
fstl1a
-0.017
LOC110439786
0.105
klhl40b
-0.017
FAM107A (1 of many)
0.105
zgc:92518
-0.017
scg2b
0.105
lrrc20
-0.017
LOC110438400
0.105
txlnbb
-0.017
olfm1b
0.104
mybphb
-0.017
si:ch211-106h4.5
0.103
mak16
-0.017
rab3aa
0.103
tsr1
-0.017
si:dkey-219e21.4
0.102
CABZ01078594.1
-0.017
sorcs3b
0.101
klhl41b
-0.017
l3mbtl1a
0.101
sgcd
-0.017
XLOC-018000
0.101
optc
-0.017
gabrg2
0.098
mss51
-0.017
CR759927.3
0.097
si:ch211-131k2.3
-0.017
rtn1b
0.097
rpl3
-0.016
cdk5r2b
0.097
tnni2b.1
-0.016
si:dkey-238f9.1
0.096
rpl30
-0.016
snap25a
0.096
fxr1
-0.016
scg2a
0.096
nr2f5
-0.016
SRCIN1
0.095
hey1
-0.016
gpr88
0.095
zgc:153981
-0.016
LOC108180743
0.094
smyd2b
-0.016