Daniocell
micu3a (endoderm)
"mitochondrial calcium uptake family, member 3a"
ZFIN
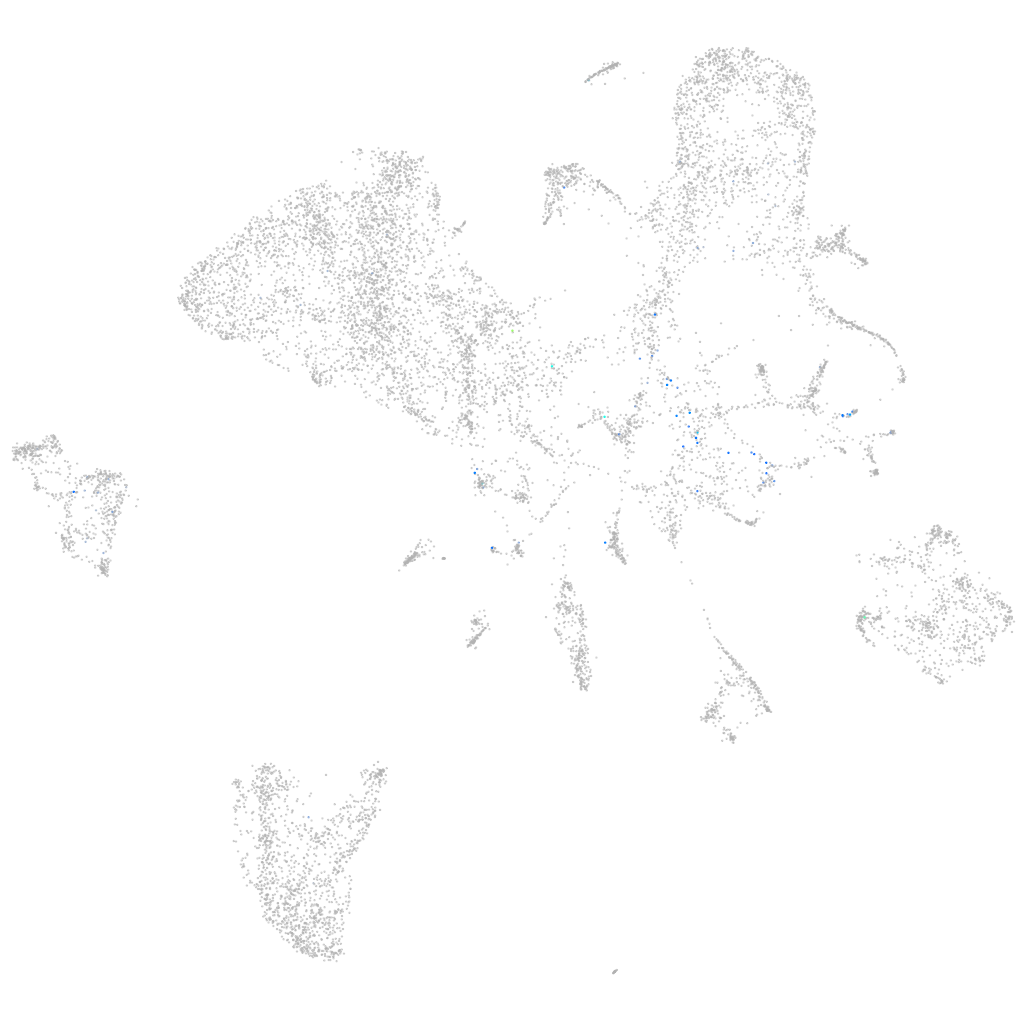
Gene expression UMAP
Display:
Expression
Stage
Other cell groups
all cells
blastomeres
PGCs
endoderm
axial mesoderm
muscle
mural cells /
non-skeletal muscle
mesenchyme
hematopoietic /
vasculature
pronephros
neural
spinal cord / glia
eye
taste / olfactory
otic / lateral line
epidermis
periderm
fin
ionocytes / mucous
pigment cells
Expression by stage/cluster
Correlated gene expression
Positive correlation
Negative correlation
Gene
r
Gene
r
CABZ01113369.1
0.296
gapdh
-0.053
RF00137
0.293
gatm
-0.050
LOC101883768
0.167
gamt
-0.046
LOC100537721
0.152
ckba
-0.046
BX248097.3
0.151
gpx4a
-0.045
zgc:175139
0.148
pnp4b
-0.043
si:dkey-161j23.7
0.143
apoa4b.1
-0.042
LOC108192085
0.138
aldob
-0.042
XLOC-036284
0.137
cx32.3
-0.042
DPYSL2 (1 of many)
0.136
atp5pf
-0.041
lrrn3b
0.134
tfa
-0.041
LOC108180795
0.134
glud1b
-0.041
BX088535.1
0.134
apoa1b
-0.041
zgc:194312
0.131
nupr1b
-0.041
gria4a
0.125
cox7a1
-0.041
dkk3a
0.123
zgc:85777
-0.041
XLOC-005605
0.122
apobb.1
-0.040
fgf20a
0.122
ddt
-0.040
si:ch73-344o19.1
0.121
suclg2
-0.039
cntnap5b
0.121
cdo1
-0.039
CR354402.1
0.121
afp4
-0.039
zgc:109913
0.120
dhrs9
-0.039
drd2b
0.120
bhmt
-0.039
zgc:173720
0.119
scp2a
-0.039
b3gnt3.1
0.118
fabp10a
-0.039
FP236454.1
0.118
haao
-0.039
v2rl1
0.116
apoc2
-0.039
XLOC-037240
0.115
rdh1
-0.039
LOC110438112
0.114
kng1
-0.038
hydin
0.113
slc27a2a
-0.038
LOC100004978
0.113
tdo2a
-0.038
CU914487.1
0.112
apoa2
-0.038
ak5l
0.111
agxtb
-0.038
evlb
0.111
BX908782.3
-0.038
CEP170B (1 of many)
0.111
cox6a1
-0.038